
Table of Contents
The average of a set of data is called the mean. The sum of squares of variations among all numbers and means is variance. The square root of variance seems to be the standard deviation. It’s a metric for how far data deviates from the average.
A Brief Outline
In statistics, the two most essential metrics are variance and standard deviation. Standard deviation is a measure of the spread of statistical data, whereas variance is a metric of how data points differ from the mean.
Variance
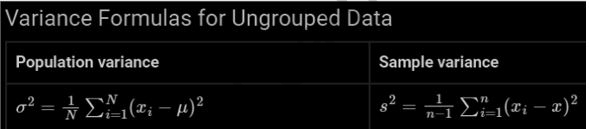
The variance, in layman’s terms, is an estimate of just how far a piece of data is distributed from its mean or average value. It is symbolized by the number ‘σ2‘.


Mean
The average of the given set of data is computed by dividing the total number of numbers by the sum of the given numbers.
Mean = (Sum of all observations/Total number of observations)
Mean for Ungrouped Data
Example:
There are 20 pupils in a class, and their grades are 88, 82, 88, 85, 84, 80, 81, 82, 83, 85, 84, 74, 75, 76, 89, 90, 89, 80, 82, and 83.
The mean is the sum of the percentages obtained
= [88 + 82 + 88 + 85 + 84 + 80 + 81 + 82 + 83 + 85 + 84 + 74 + 75 + 76 + 89 + 90 + 89 + 80 + 82 + 83] /20 = 1660/20 = 83 %
Mean for Grouped Data
In statistics, the mean, or arithmetic mean, of a group of numbers is the sum of the numbers divided by the number of numbers in the group. The mean is a measure of the central tendency of a group of numbers.
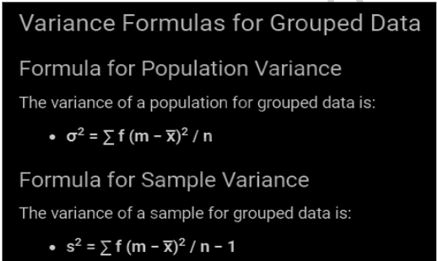
When dealing with grouped data, the mean is calculated by first finding the midpoint of each group, then finding the sum of the numbers in each group, and finally dividing the sum by the number of groups.
The mean is often used to compare two or more groups of data. If the means of two groups of data are different, it can be said that the two groups are not statistically the same.


Standard deviation
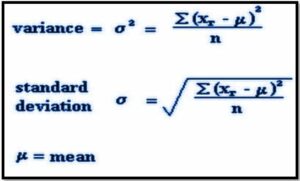
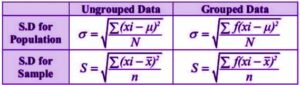
Standard deviation is a measure of how much a set of data deviates from the average. It is calculated by taking the square root of the variance. The standard deviation is usually represented by the letter “s”.
A low standard deviation means that the data is clustered closely around the average. A high standard deviation means that the data is spread out more.
Standard deviation is used to calculate the probability of an event. It can also be used to determine how likely it is that a sample is representative of the population.
Standard deviation is an important statistic for researchers and scientists. It can be used to help them make predictions about the behavior of a population.
Significance of variance, mean, standard deviation in IIT JEE exam
The variance, mean and standard deviation are all important measures of variability in data. The variance is a measure of how much the data points vary from the mean, while the standard deviation is a measure of how spread out the data points are.
The variance and standard deviation are both used to measure the risk of an investment. The higher the variance or standard deviation, the higher the risk of the investment. The mean is also important because it is used to calculate the return on an investment.
FAQs
We study about three forms of means in statistics: Arithmetic Mean, Geometric Mean, and Harmonic Mean.
Variance is a measure of the deviation of values or occurrences from the mean in statistics.
For a given collection of observations, variance is the square of standard deviation. The variance is equal to 2 if is the standard deviation. What are the different kinds of Mean?
In statistics, what is a variance?
What is the relationship between standard deviation and variance?
