Table of Contents
CBSE Sample Papers for Class 12 Economics Outside Delhi -2012
Time allowed : 3 hours Maximum marks 100
GENERAL INSTRUCTIONS
- All questions in both the sections are compulsory.
- Marks for questions are indicated against each.
- Questions No. 1-5 and 17-21 are very short-answer questions carrying 1 nick each. They are required to be answered in one sentence each.
- Questions No. 6-10 and 22-26 are? short-answer questions carrying 3 marks each. Answers to them should normally not exceed 60 words each.
- Questions No. 11-13 and 27-29 are also short-answer questions carrying 4 marks each. Answers to them should normally not exceed 70 words each.
- Questions No. 14-16 and 30-32 are long-answers questions carrying 6 marks each. Answers to them should normally not exceed 100 words each.
- Answers should be brief and to the point and the above word limit should be adhered to as far as possible.
SET I
SECTION A
Question.1. Define microeconomics.
Answer. Microeconomics is the study of individual economic units, such as a firm, an industry, a consumer etc.
Question.2. Give one reason for a shift in demand curve.
Answer. A demand curve shifts when there is a change in a factor other than the own price of the product.
Question.3. What is the behaviour of Total Variable Cost, as output increases?
Answer. When output increases total variable cost increases at a decreasing rate and after a point it increases at an increasing rate.
Question.4. What is fire behaviour of Marginal Revenue in a market in which a firm can sell any quantity of the output it produces at a given price?
Answer. In the given situation marginal revenue in the market will remain the same throughout. This situation relates to perfect competition.
Question.5. What is a price-maker firm?
Answer. A price-maker firm is one which participates in the fixation of the price of the product. A monopoly firm is a price-maker firm.
Question.6. Define Production Possibility Curve. Explain why it is downward sloping from left to right
Answer. A Production Possibility Curve may be defined as a curve which represents various possible combinations of two goods that can be produced with the full use of given resources in an economy under given technological conditions.
A PP curve slopes downwards from left to right because of the fact that in a combination if we produce more of one good, with given fixed resources, we shall produce less of the other good.
Question.7. A consumer consumes only two goods X and Y and is in equilibrium. Price of X falls. Explain the reaction of the consumer through the Utility Analysis.
Answer. The basic condition fulfilling the condition of consumer’s equilibrium in the case of two commodities according to utility analysis is:
\(\frac { { MU }_{ x } }{ { P }_{ x } } =\frac { { MU }_{ y } }{ { P }_{ y } } \)
As such, if the price of X falls, per rupee marginal utility of X will increase and becomes more titan that of Y. The consumer will transfer expenditure from Y to X, and will buy more of X.
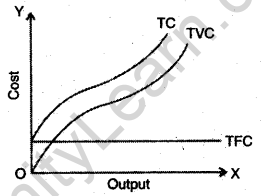
Question.8. Draw Total Variable Coat, Total Cost, and Total Fixed Cost curves in a single diagram.
Answer.
The following question is for the blind candidates in lieu of Q. No. 8 Explain the behaviour of total cost as output increases.
Answer. Total cost in die short period is the sum of total variable cost (TVC) and total fixed cost (TFC). Total variable cost initially increases with the increase in output at a decreasing rate and after that it increases at an increasing rate. Therefore total cost initially increases at a decreasing rate and after that increases at an increasing rate.
Question. 9. A producer starts a Business by investing his own savings and hiring the labour. Identify implicit and explicit costs from this information. Explain.
Answer. In the given situation:
- The producer uses his own savings in the business which elsewhere would have earned interest Therefore imputed value of the interest on the savings invested is implicit cost.
- The cost of hiring labour from the market involves expenditure incurred by the producer. Therefore the wages paid to the labour ere explicit costs.
Question.10. Explain the implications of large number of sellers in a perfectly competitive market.
Answer. See Q. 10, 2011 (I Outside Delhi).
Or
Explain why them are only a few firms in an oligopoly market.
Answer. Under oligopoly there are only a few large firms, each producing a significant portion of the market output. Barriers, such as, patents, large capital requirement control over raw material, etc., prevent new firms from entering into industry. Small firms, in general, do not survive because of the threat of competition, though they are independent to exist.
Question.11. Define an indifference map. Why does an indifference curve to the rigid show more utility? Explain.
Answer. See Q. 11, 2012 (III Delhi).
Question.12. A consumer buys 10 units of a commodity at a price of Rs 10 per unit. He incurs an expenditure of Rs 200 on buying 20 units. Calculate price elasticity of demand by the percentage method. Comment upon the shape of demand curve based on this information.
Answer.
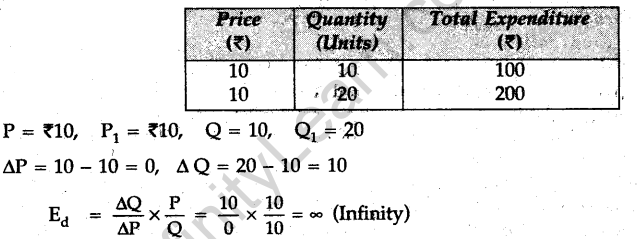
Since the price remains the same the shape of demand curve will be perfectly elastic. Demand Curve will be parallel to x-axis.
Question.13. What does the Law of Variable Proportions show? State the behaviour of marginal product according to this law.
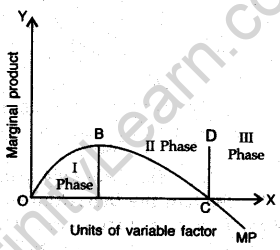
Answer. The law of variable proportions shows that if one factor is variable and others are fixed how the total product will be affected; According to this law if the units of a variable factor are increased the total product will increase at an increasing rate. This law can be divided into three distinct stages. The behaviour of MP curve will be as shown in the diagram.
- In the first stage, the firm goes from the point of origin to the point where MP curve is maximum. According to diagram this stage is from“point of origin to point B. In this stage MP curve rises and reaches the maximum.
- In the second stage, MP curve ranges from point B (where it is maximum) to point C (where it is zero) ie., MP decreases but is positive.
- The third, stage goes from point C and goes below X-axis. In this phase, MP decreases and is negative. Therefore a firm always operates in the second stage.

Or
Explain how changes in prices of inputs influence the supply of a product.
Answer. The increase-in the prices of inputs or factors of production leads to an increase in the cost of production which adversely affects the supply of a commodity.For example, when factor prices go up, the cost of production goes up. With the result the supply of a commodity will be less at a given price.
Similarly, when prices of inputs of factors of production fall, the cost falls. The cost of the product remains unchanged and the fall in cost leads to a rise in profit. This induces producers to supply more.
Question.14. Explain the difference between
(i) inferior goods and normal goods and (ii) cardinal utility and ordinal utility.
Give example in each case.
Answer. (i) Inferior goods are those whose demand falls with the rise in income. This is because as income rises, purchasing power increases and the consumers substitutes superior goods for inferior goods. In short, those goods whose income effect is negative are called inferior goods.
Normal goods are those whose demand increases with the increase in income and vice versa. Consumers buy more of the good when their incomes increase.
In short, when income increases the demand for normal goods increases and the demand for inferior goods fall.
(ii) Cardinal utility means the utility derived from units consumed in exact numerical terms. Such as utility obtained from the first unit consumed is 10, the second unit consumed is 8 etc. Utility analysis approach explaining consumer’s behaviour is based on cardinal approach. However, its shortcoming has been pointed out by indifference curve approach.
Ordinal utility approach explains consumer’s behaviour in the order of preferences of the combinations of two commodities instead of adopting cardinal utility approach. Indifference curve approach is based on ordinal approach. It is because of the fact that indifference curves express level of satisfaction, which may be more or less, rather than expressing tire level of satisfaction numerically.
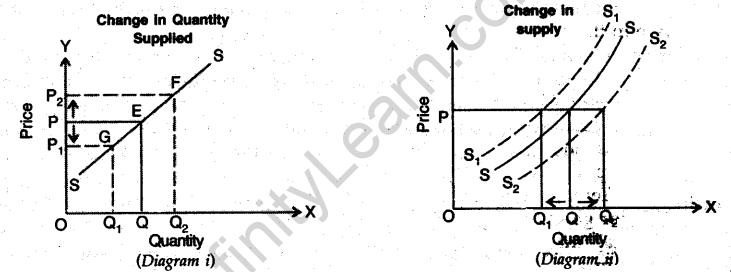
Question.15. Explain the distinction between “change in quantity supplied” and, “change in supply”.Use diagram.
Answer. Change in quantity supplied means the changes in supply which are Used by the changes in the price of the good, other things remaining constant. In this case when price increases quantity supplied also increases and when price falls quantity supplied also falls. In this case, a movement along the supply curve takes place upwards or downwards , as the case may be. As shown below in the diagram, when price increases from OP to OP1, there is a movement on supply curve from point E to point R On the other hand, when price falls from OP to OP1, there is a movement downward on the supply curve from point E to point G. When price increases, Quantity supplied also increase and when price falls. Quantity supplied also falls. This is clear looking at the diagram(i) .
Change in supply. In case of change in supply, quantity supplied increases or decreases due to factors other than price. These factors may be price of other commodities, state of technology, cost of production etc. In short,“in the case of change in supply Quantity supplied is either more or less at the same price.
In the case of change in supply, a shift takes place in the supply curve towards right when there is an increase in supply and towards left when there is a decreased in supply. As shown in the Diagram (ii), when supply curve shifts to S1S1 supply falls from OQ to OQ1. On the with the other hand, when there is a shift in curve from SS to S2S2 supply increases from OQ to OQ2. In both the case price remains the same i.e..OP.
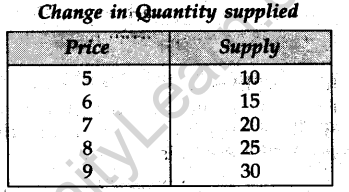
The following question is for the Blind Candidates only, in lieu,of Q. No, 15 Explain the distinction between “change in quantity supplied” and “change in supply” with the help of table.
Answer. Change in quantity supplied means the changes in supply which are to a used by the changes in the price of the good, other things remaining constant. In this case when price increases quantity supplied also increases and when price falls quantity supplied also falls. In this case, a movement along the supply curve takes place upwards or downwards as the case may be. The change in quantity supplied as explained above can be better understood looking at the schedule given below. It is clear from the schedule that when, price goes up, quantity supplied also goes up and vice versa.
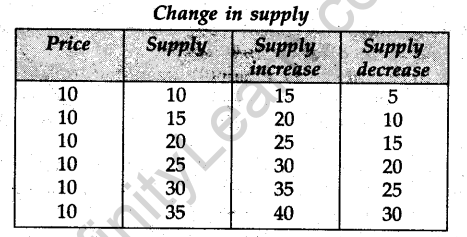
Change in supply. In case of change in supply, quantity supplied increases or decreases due to factors other than price. These factors may be price of other commodities, state of technology, cost of production etc. In short, in the case of change in supply Quantity supplied is either more or less at the same price.
Change in supply as explained above becomes evident looking at the schedule given below. It is clear from the schedule, in the case of increase in supply, supply increases at the same price and in the case of decrease in supply, supply falls at the same price.
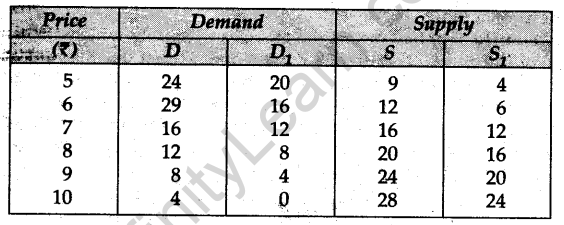
Question.16. Market for a good is in equilibrium. These is simultaneous “decrease” both in demand and supply but there is no change in market price. Explain with the help of a schedule how. it is possible.
Answer. Market price is in equilibrium where quantity supplied and quantity demanded are equal. According to a hypothetical demand supply schedule given below, the equilibrium price is Rs 7 where quantity demanded and supplied both are 16 units. Now in a new given situation there is simultaneous decrease both in demand and supply but there is no change in market price. Therefore according to the new stated condition D1 (Demand schedule) and (Supply schedule) is drawn. Assuming that there is no change in market price, market price remaining the same, new demand and supply are equal at 12 units. Therefore, in the original condition the equilibrium quantity is 16 and in the new situation equilibrium quantity is different but the price is the same, i.e., Rs 7. This has been possible because there is equal decrease both in demand and supply in the new situation. It is because of that the equilibrium quantity has fallen from 16 to 12 units.
Or
Market for a good is in equilibrium. Explain the chain of reactions in the market if the price is
(i) higher than equilibrium price and (ii) lower than equilibrium price.
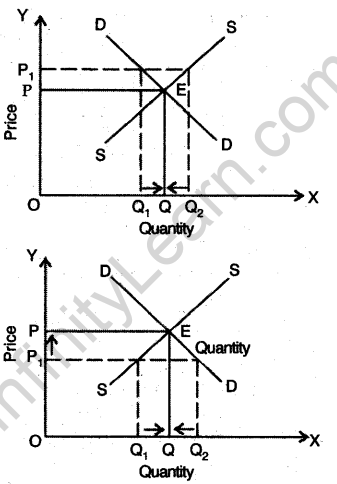
Answer. (i) When market price is higher than the equilibrium price. There is excess supply and producers are not in a position to sell at the given price. This leads to competition among producers which leads to lowering of price which in turn raises the demand and the supply reduces.
As shown in the diagram, equilibrium price is OP where equilibrium quantity is OQ. Say, if market price is fixed at OPj then there will be disequilibrium between demand and supply.
Demand will be OQ1 and supply OQ2, thus there will be excess of supply equal to Q1Q2. For bringing equality between demand and supply, market price should be reduced from OP1 to OP, so that there is no excess supply.
(ii) When market price is lower than the equilibrium price. There is excess demand and consumers are not able to buy all they want to buy at the given price. This leads to competition between consumers which leads to a rise in price. Rise in price reduces demand while raises supply. As shown in the diagram, equilibrium price is OP .
and quantity demanded OQ. If OP1 is fixed as market price (lower than the equilibrium price), there will be excess demand equal to Q1Q2. Therefore for bringing about an equality between demand and supply, market price needs to be increased from OP1 to OP, so that there is no excess demand.
SECTION B
Question.17. Define flow variable.
Answer. Flow variables are those economic concepts whose value can be ascertained during a period of time, such as income.
Question.18. Define consumption goods.
Answer. Consumption goods are those goods which are used by the consumers for satisfaction and are not used in the process of further production.
Question.19. What are time deposits?
Answer. Those bank deposits which cannot be withdrawn before the expiry of the stipulated time for which they are deposited are time deposits, such as fixed deposits.
Question.20. Define a ‘direct tax’.
Answer. Direct tax is a tax where the liability to pay and the incidence of tax is on the same person or firm such as income tax.
Question.21. What is a fixed exchange rate?
Answer. Fixed exchange rate is fixed by the Government /Central Bank.
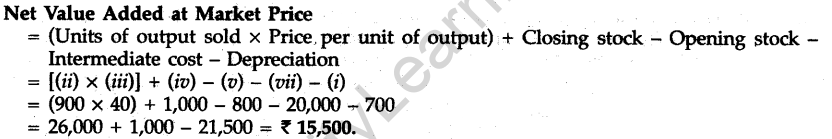
Question.22. Find Net Value Added at Market Price:
(i) Depredation (Rs) 700
(ii) Output sold (units) 900
(iii) Price per unit of output (Rs) 40
(iv) Closing stock (Rs) 1,000 ‘
(v) Opening stock (Rs) 800
(vi) Sales tax (Rs) 3,000
(vii) Intermediate cost (Rs)
Answer.
Question.23. Explain the ‘standard of deferred payment’ function of money.
Answer. Money, besides being the basis of current transactions, is also the basis of deferred^ payments. Only money is such a commodity in whose form accounts of deferred payments can be maintained in such a way so that both creditors and debtors do not stand to lose. Money makes borrowings and lendings convenient.
Question.24. Outline the steps taken in deriving Consumption Curve from the Saving Curve. Use diagram.
Answer. Before deriving consumption curve from saving curve we should know tire following:
- Y = C + S
.-. S = Y – C . - C = Autonomous consumption + That part of income which is consumed, as such.
When C is positive, saving is negative and when C = Y, S = 0 - On the basis of this information, we can draw consumption curve and saving curve as shown in the diagram.
In the diagram, SS is saving curve. At OS level of income C = Y, therefore S is zero. Beyond that SS becomes positive. When SS is positive consumption is less than income and the part of consumption curve is MC.


The following question is for the Blind Candidates only, in lieu of Q. No. 24 Distinguish between propensity to consume and propensity to save, with the help of numerical examples.
Answer. Propensity to consume is the ratio of change in consumption over change in income. In short,
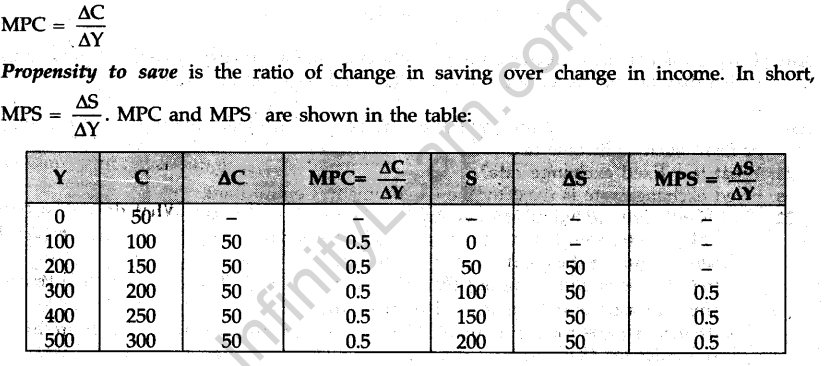
Question.25. Find Consumption Expenditure from the following:
National Income = Rs 5,000
Autonomous Consumption = Rs 1,000
Marginal propensity to consume = 0.80
Answer. National Income, Y = Rs 5,000
Autonomous consumption (a) = Rs 1,000 Marginal propensity to consume (b) = 0.80
Consumption, (C) = a + bY = 1,000 + 0.8 (5,000) = 1,000 + 4,000 = Rs 5,000
Question.26. Distinguish between revenue receipts and capital receipts in a government budget. Give example in each case.
Answer. Revenue receipts are those which do not either create a liability or lead to a reduction in assets, such as tax revenue.
Capital receipts are those which government raises through funds either by incurring liability or by disposing of assets, such as recovery of loans, loans raised etc.
Or
Explain the role of government budget in bringing economic stability.
Answer. See Q. 27 (Or), 2011 (I Outside Delhi).
Question.27. Should the following be treated as final expenditure or intermediate expenditure? Give reasons for your answer.
- Purchase of furniture by- a firm
- Expenditure on maintenance by a firm.
Answer.
- Purchase of furniture by a firm is a final expenditure because it is a kind of investment.
- Expenditure on maintenance by a firm is an intermediate expenditure because it occurs again and again and is not of permanent nature.
Question.28. Explain the ‘lender of last resort’ function of the central bank.
Answer. When commercial banks exhaust all resources to supplement their funds at the time of liquidity crisis, the Central bank acts as the lender of the last resort for them. When Commercial banks cannot meet obligations of their depositors, the Central bank comes to their help. The Central Bank advances credit against eligible securities subject to certain terms and conditions. This saves the Commercial banks from a possible breakdown. This is an important function of the Central bank in the banking system of a country.
Or
Explain government’s banker function of the Central bank.
Answer. The Central bank functions as a commercial bank for the government. As banker to the government, the Central bank provides all those services and facilities to the government which public gets from the ordinary Banks. It operates the accounts of the public enterprises. It manages government departmental undertakings and government funds, and when the need arises, gives loans to the government. It looks after the management of public debt. It accepts the payment of taxes from the public on behalf of the government and makes payment for the cheques issued by the government. It also undertakes transactions relating to foreign currencies on behalf of the government.
Question.29. Explain the concept of ‘fiscal deficit’ in a government budget. What does it indicate?
Answer. Fiscal deficit refers to the excess of total expenditure over total receipts (excluding borrowings) during the given fiscal year. It indicates that:
- the total borrowings of the government are increasing. If fiscal deficit is increasing the amount of debt repayment is also increasing.
- for meeting the borrowing requirements, the government may borrow from the Reserve Bank of India. When RBI prints new currency to meet the deficit requirements, it increases the money supply in the economy and creates inflationary pressure.
- the debt and financial burden of interest payments on the revenue expenditure causes a reduction on the capital expenditure for growth and development of the economy.
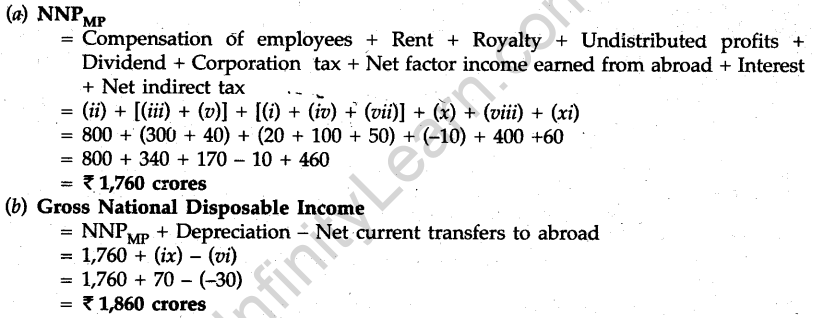
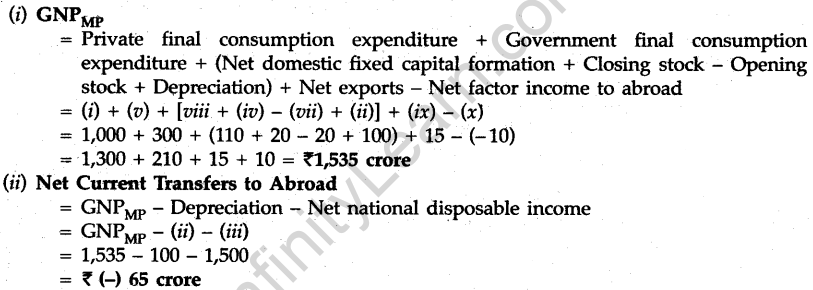
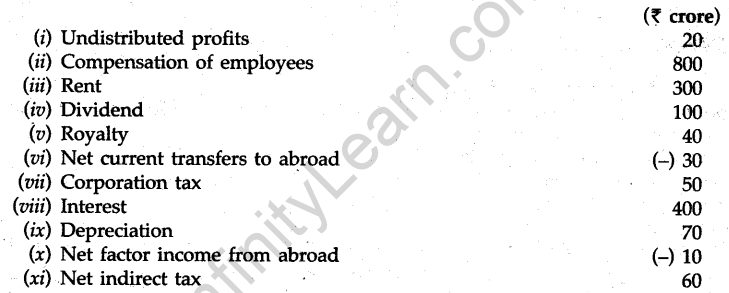
Question.30. Find out (i) Gross National Product at Market Price and (ii) Net Current Transfers to Abroad:
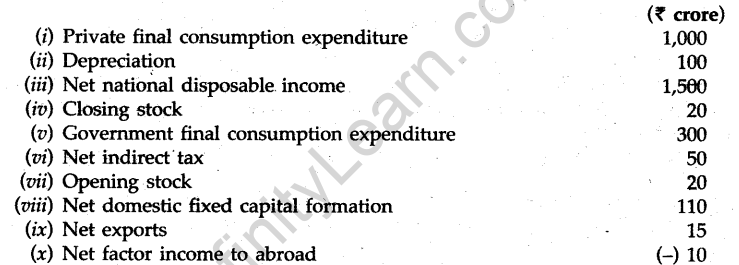
Answer.
Question.31. Explain the concept of ‘inflationary gap’. Also explain the role of ‘legal reserves’ in reducing it.
Answer. Inflationary Gap: See Q. 30 (Point (i) Legal Reserves), 2011 (I Outside Delhi) .
Or
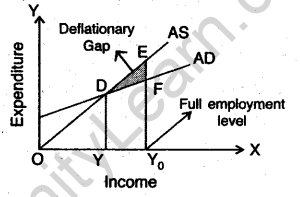
Explain the concept of ‘deflationary gap’. Also explain the role of ‘margin requirements’ in reducing it
Answer. The situation of deflationary gap arises when equilibrium is established before the stage of full employment of output. In this case, at the full employment level, aggregate demand is less than aggregate supply. In the diagram, EF is deflationary gap. For removing deflationary gap, the level of aggregate demand needs to be increased. Margin requirements. Commercial banks never advance loans to its customers equal to the full value of collateral or securities. They always keep a margin with them/ such as keeping & margin of 20% and advancing loans equal to 80% of value of security. The rate of margin is determined by the Central bank. In the situation of deflationary gap, this margin will be reduced so that more credit may be advanced against the security.
Question.32. Give the meaning of ‘foreign exchange’ and foreign exchange rate’. Giving reason, explain the relation between foreign exchange rate and demand for foreign exchange.
Answer. (i) Foreign exchange. It simply means foreign currency. It also means the stock of foreign currency of a country. In this sense, foreign exchange means the stock or reserves of foreign currency. The total reserves of foreign currency is the stock of foreign currencies that a country holds at a given time.
(ii) Exchange rate. The rate at which domestic currency (say Rs) is exchanged for currency of another country (say US $) is known as the rate of exchange. In other words, prices of currencies in terms of each other are called foreign exchange rates. The rate of exchange, therefore, shows the external value of home currency. Therefore, in a sense it reflects the purchasing power of a country’s currency in terms of another country’s currency. For example, if US $ is equal to 55 Indian rupees, then exchange rate between American dollar and Indian rupee is $1 = Rs 55.
There is an inverse relationship between foreign exchange rate and demand for foreign exchange. Higher is the exchange rate lower is the demand for foreign exchange and vice-versa.
The inverse relation between the two can be explained with the help of an example. Say the price of US dollar in India falls from Rs 55 to Rs 50, this means now Indian people will pay Rs 50 to buy goods worth US $1 from America instead of ? 55. This means the American goods have become cheaper for Indians. Thus when exchange rate falls, the demand for foreign currency increases. The reverse of it will happen when foreign exchange rate increases.


SET II
Note : Except for the following questions, all the remaining questions have been asked in Set I.
SECTION A
Question.6. Explain the central problem of ‘how to produce’.
Answer. A number of methods are available to a producer for producing a good. In such a situation a producer decides as to how the factors should be combined in producing a commodity. A producer will use that combination or technique of production where the cost is minimum. This is the central problem of how to produce in an economy. This problem arises because of the fact that resources are scarce.
Question.9. A farmer takes a farm on rent and carries on farming with the help of family members. Identify explicit and implicit costs from this information. Explain.
Answer.
- In the given example, the farmer carries on farming with the help of family members. If these members had worked elsewhere they would have earned wages. Therefore, the imputed expenditure incurred on the wages of family members is implicit cost.
- The farmer takes the farm on rent. Therefore, die expenditure incurred on rent (input) is explicit cost.
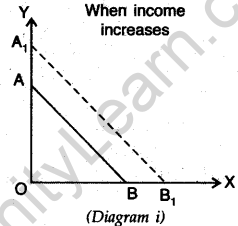
Question.11. Define a budget line. When can it shift to the right?
Answer. A budget line graphically shows die many combinations of two goods which a consumer can buy, given his entire income and the prices of the two goods. A budget line, as shown in the diagram is a straight line having a negative slope.
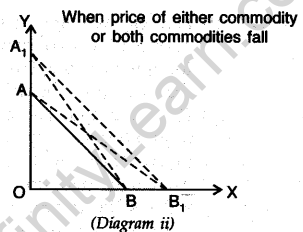
There will be a shift in the budget line towards right when:
- income of the consumer increases, prices of both the goods given, as shown in Diagram (i).

- price of either of the too commodities or of both the commodities fall, as shown in Diagram (ii).

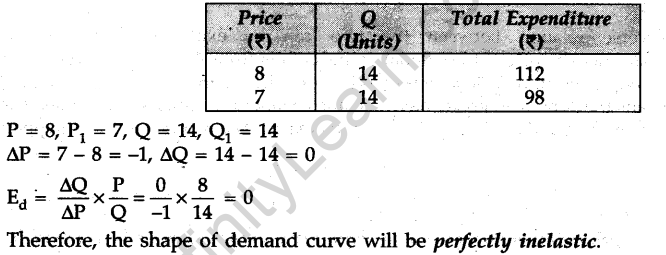
Question.12. A consumer buys 14 units of a good at a price of Rs 8 per unit. At price Rs 7 per unit he spends Rs 98 on the good. Calculate price elasticity of demand by the percentage method. Comment upon the shape of demand curve based on this information.
Answer.
SECTION B
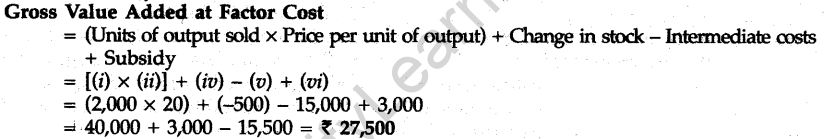
Question.22. Find Gross Value Added at Factor Cost:
(i) Units of output sold 2,000
(ii) Price per unit of output (Rs) 20
(iii) Depreciation (Rs) 2,000
(iv) Change in stock (Rs) (-) 500
(v) Intermediate costs (Rs) 15,000
(vi) Subsidy (Rs) 3,000
Answer.
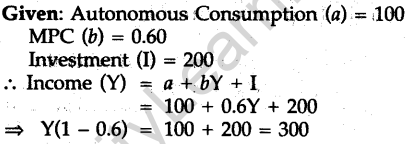
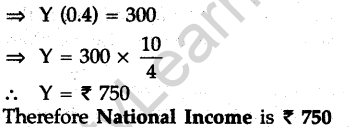
Question.25. Find National Income from the following:
Autonomous Consumption = Rs 100
Marginal propensity to consume = 0.60
Investment = Rs 200
Answer.
Question.27. Giving reason, explain how should the following be treated while estimating National Income:
(i) Expenditure on free services provided by government
(ii) Payment of interest by a government firm.
Answer. (i) It should be included because it is a government final consumption expenditure.
(ii) It should not be included because it is an intermediate cost.
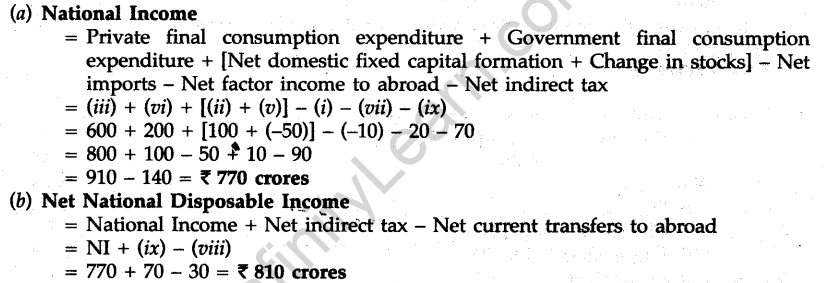
Question.30. Find out (i) National Income and (ii) Net National Disposable Income:
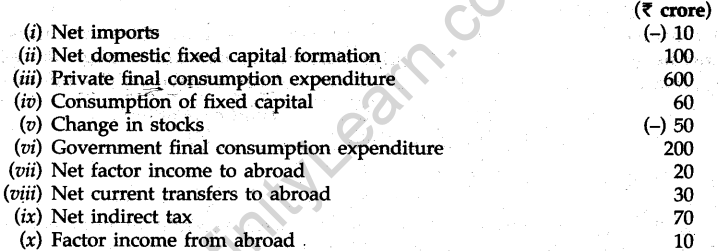
Answer.
SET III
Note: Except for the following questions, all the remaining questions have been asked in Set I and Set II.
SECTION A
Question.6. What is Opportunity Cost? Explain with the help of an example.
Answer. See Q. 6, 2012 (I Delhi). II
Question.9. A producer borrows money and starts a business. He himself looks after die business.Identify implicit and explicit costs from this information. Explain.
Answer.
- In the given example, the producer borrows money and starts his business, therefore the expenses incurred (interest) on money borrowed is explicit cost.
- The producer looks after the business himself, therefore the imputed cost of the efforts of the businessman is implicit cost. Had he worked somewhere else, he would have earned some money.
Question.11. What is budget set? Explain what can lead to change in budget set
Answer. The set of all possible consumption bundles of two goods that a consumer can afford given the prices of goods and the income level of the consumer is called the budget set. The budget set changes when either the prices or income of the consumer change. Using M as income, as price of good X, and P2 as price of good Y, a consumer can buy any bundle which he can get by spending M on good X and good Y in the following manner:
\({ P }_{ 1 }X+{ P }_{ 2 }\le M\)
This means money spent on good X and Y should not exceed income. Therefore, if a change takes place in the budget set, it will take place due to change in money variables fulfilling the basic condition stated above.
Question. 12. A consumer buys 8 units of a good at a price of Rs 7 per unit. When price rises to Rs 8 per unit he buys 7 units. Calculate price elasticity of demand through the expenditure approach. Comment upon the shape of demand curve based on this information.
Answer.
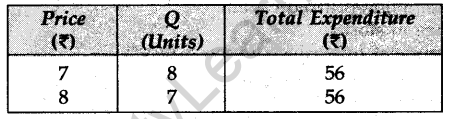
According to expenditure method, since the total expenditure does not change, the elasticity of demand will be equal to -1.
In this case, the demand curve will be a rectangular hyperbola.
SECTION B
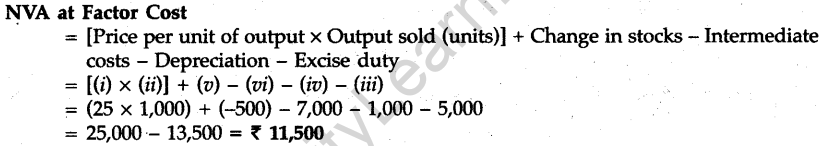
Question.22. Find out Net Value Added at Factor Cost:
(i) Price per unit of output (Rs) 25
(ii) Output sold (units) 1,000
(iii) Excise duty (Rs) 5,000
(iv) Depreciation (Rs) – 1,000
(v) Change in stocks (Rs) (-) 500
(vi) Intermediate costs (Rs) 7,000
Answer.
Question.25. Find Investment; from the following:
National Income – Rs 600
Autonomous Consumption = Rs 150
Marginal propensity to consume = 0.70
Answer. Given, National Income (Y) = Rs 600
Autonomous Consumption (a) =Rs 150
MPC (b) = 0.70 .-. Y = a + bY + I
or 600 = 150 + (0.7 x 600) + I
or 600 = 150 + 420 + I
or 600 – 570 = I
or I = 30
Question.27. How should the following be treated while estimating National Income? Give reasons.
- Expenditure on education of children by a family.
- Payment of electricity bill by a school.
Answer.
- Expenditure on education of children by a family is a final consumption expenditure of households because it is a payment for the services rendered by the school. It will be included.
- Payment of electricity by a school is intermediate cost of the school and therefore is used for finding out value added and not directly included in the estimation of national income.
Question.30. Find out (i) Net National Product at Market Price and (ii) Gross National Disposable Income form the following:
Answer.