
Table of Contents
CBSE Previous Year Question Papers Class 12 Economics 2014 Delhi
Time allowed : 3 hours
Maximum marks: 70
** Answer is not given due to change in the present syllabus
CBSE Previous Year Question Papers Class 12 Economics 2014 Delhi Set – I
Note: Except the following questions, all the remaining questions have been asked in previous sets.
Section – A
Question 1.
Unemployment is reduced due to the measures taken by the government. State its economic value in the context of production possibilities frontier. [1]
Answer:
Due to the measures taken by the government to reduce the unemployment, the point which was earlier below the production possibility curve (indicating under utilisation of resources) will shift close to or on the PPC (indicating better utilisation of resources). Hence, economic value is reflected in terms of increased output and income.
Question 2.
Define budget set. [1]
Answer:
A budget set or opportunity set includes all possible consumption bundles that someone can afford with the given the prices of goods and the person’s income level.
Question 3.
What is meant by revenue in microeconomics? [1]
Answer:
In microeconomics, revenue(R) refers to money receipts of a producer from the sale of his output.
Question 4.
Give meaning of ‘returns to a factor’. [1]
Answer:
Returns to a factor means the change in output when an additional unit of variable input is employed. The Law of Variable Proportion can be regarded as ‘Returns to a Factor’.
Question 5.
What is perfect oligopoly? [1]
Answer:
Perfect oligopoly is a market form in which a market or industry is dominated by a small number of sellers (oligopolists) who produce homogenous products. For example, Cement industry or Chemical industry.
Question 6.
Explain the central problem ‘for whom to produce’ [3]
Answer:
The central problem being “for whom to produce” basically throws light on the distribution mix of the final goods and services produced. The distribution of the final goods and services is equivalent to the distribution of National Income (or National Product) among the factors of production such as land, labour, capital and entrepreneur.
For instance, imagine an economy producing two goods – normal rice (priced at ₹ 15/kg) and graded rice (priced at ₹ 100/kg). If the economy decided to cater to the needs of the lower section of the society, then it would produce more of normal rice and less of the graded rice.
On the other hand, if the economy decided to cater to the needs of the higher section of the society, then it would produce more of the graded rice and less of the normal rice.
Question 7.
A consumer buys 18 units of a good at a price of ₹ 9per unit. The price elasticity of demand for the good is (-) 1. How many units the consumer will buy a price of ₹ 10 per unit? Calculate. [3]
Answer:
Given, Q1 = 18, Q2 = ?, P1 = ₹ 9 and P2 = ₹ 10
Therefore, DQ = Q2 – Q1
DP = P2 – P1 = ₹ 1
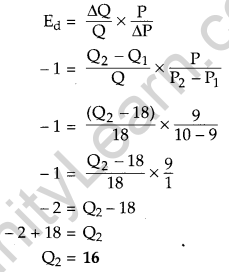
Therefore, the consumer will buy 16 units of the good at a price of ₹ 10
Question 8.
State the relation between marginal revenue and average revenue. [3]
OR
State the relation between total cost and marginal cost.
Answer:
The relationship between marginal revenue and average revenue can be divided under two forms of market – under Perfect Competition market and under Imperfect Competition market.
Under Perfect Competition market, average revenue equals marginal revenue throughout all output levels. Graphically, marginal revenue curve is a straight horizontal line parallel to the x-axis and coincides with the average revenue curve.
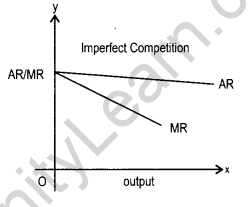
Under Imperfect Competition market, as output increases both average revenue and marginal revenue fall. However, average revenue remains greater than marginal revenue at all levels of output. Graphically, both average revenue curve and marginal revenue curve are downward sloping but the AR curve remains above the marginal revenue curve.
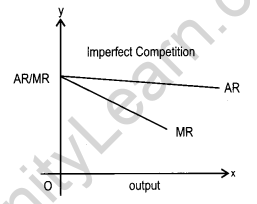
MR may even go to zero or negative but AR curve continues to be positive.
OR
In economics and finance, marginal cost is the change in the total cost that arises when the quantity produced has an increment by unit. Marginal Cost is derived from Total Cost by using the following formula :
MCn = TCn — TCn-1
where,
MCn represents Marginal Cost of producing ‘n’ units of output
TCn represents Total Cost of producing units of output
TCn-1 represents Total Cost of producing ‘n – 1’ units
While, Total Cost refers to the total cost of production that is incurred by a firm in the short run to carry out the production of goods and services. It is the aggregate of expenditure incurred on fixed factors as well as variable factors. Total cost can be derived by summing up marginal cost at all the levels of output.
Question 9.
What is the behaviour of average fixed cost as output is increased? Why is it so? [3]
Answer:
Average Fixed Cost can be described as the fixed cost per unit of output produced. It is described by dividing the entire Fixed Cost by quantity of output produced. That is,
AFC = TFC /Q
where, TFC represents Total Fixed Cost
Q represents units of output produced
Average fixed cost continues to fall with an ‘ increase in the level of output but, it nerver reaches to zero because average fixed cost is a rectangular hyperbola. That is, it can never be zero. This happens because AFC is defined as the ratio of TFC to output. We know that TFC remains constant throughout all the output levels and as output increases, with TFC being constant, AFC decreases. When output level is close to zero, AFC is infinitely large and by contrast when output level is very large, AFC tends to be zero but never becomes zero. AFC can never be zero because it is a rectangular hyperbola and it never intersects the x-axis and thereby it can never be equal to zero.
Question 10.
Why are the firms said to be interdependent in an oligopoly market? Explain. [3]
Answer:
Firms are said to be interdependent in an oligopoly market because the firms under such a market structure experience a high degree of mutual interdependence. It is because the price and the output decisions of the firms are interdependent on each other. The price and output policy of a firm affects the policies and profit of another firm. This is because when one firm lowers (or rises) its prices, the rival firms may or may not follow suit. This makes the demand curve under the oligopoly market structure indeterminate, thereby making the firms mutually interdependent in an oligopoly market.
Question 11.
A consumer consumes only two goods. Explain consumer’s equilibrium with the help of utility analysis. [4]
OR
A consumer consumes only two goods A and B and is in equilibrium. Show that when price of good B falls, demand for B rises. Answer this question with the help of utility analysis.
Answer:
The consumer’s equilibrium in this scenario can be explained by the Law of Equi-Marginal Utility. According to this, a consumer allocates his expenditure between two commodities in such a manner that the utility derived from each additional unit of the rupee spent on each of the commodities is equal to the marginal utility of money. This is algebraically described as follows :
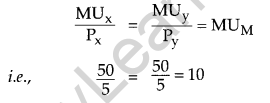
MUx / Px = MUy / Py = MUn / Pn = MUM where,
MUM represents the marginal utility of money
MUx represents the marginal utility of good x
MUy represents the marginal utility of good y
Let us suppose that MUM is ₹ 10 and the price of both the goods i.e., Px and Py is same at ₹ 5. MUx and MUy for different units of goods consumed is tabulated below.
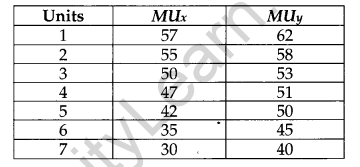
From the schedule, we can conclude that the consumer attains equilibrium when he consumes 3 units of good x and 5 units of good y. At this consumption bundle, the consumer’s equilibrium is Featured by :
OR
In this situation, the consumer’s equilibrium is attained at that point, where Q the utility derived from each additional unit of the rupee spent on each of the goods is equal. That is, Marginal Utility of a Rupee spent on the good A (i.e., MUA /PA) is equal to the Marginal Utility of a Rupee spent on the good B (i.e., MUB / PB), which in turn is equal to the Marginal Utility of Money (MUM). That is,
MUA/PA = MUB/PB = MUM
If price of the good B falls, then the value of the fraction (i.e., MUB / PB) increases.
Mathematically, this implies: MUB/PB > MUA/PA = MUM
In such a situation, the demand for good B rises and consumer would increase his consumption of good B. He will continue to increase the consumption of good B until the equality between the marginal utilities of each of the goods become equal to the marginal utility of money. At this situation, the equilibrium is restored. That is, MUA/PA = MUB/PB = MUM
Question 12.
What happens to the demand of a good when consumer’s income changes? Explain. [4]
Answer:
The demand for goods is affected by change in the income of the buyer. The effect of change in income on the demand depends on the Quality of the good.
Demand for normal goods makes a positive relationship with buyer’s income. As income increases, the demand for normal goods also increases and vice-versa.
Demand for inferior goods (such as coarse cereals) shares a negative relationship with consumer’s income. As income increases, the demand for inferior goods falls and vice-versa.
Giffen goods are those goods which are highly inferior. Similar to the inferior goods, demand for Giffen goods also shares a negative relationship with the income.
Question 13.
State the behaviour of marginal product in the law of variable proportions. Explain the cause of this behaviour.
Answer:
Law of variable proportions
As per the law of variable proportion, if more and more units of variable factor (labour) are combined with the same quantity of fixed factor (capital) then initially the total product will increase. But gradually, after a point, the total product will fall.
Behaviour of MP
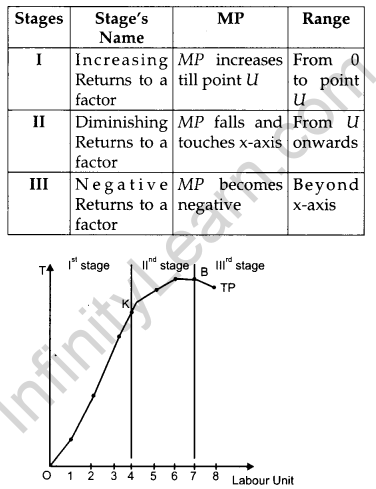
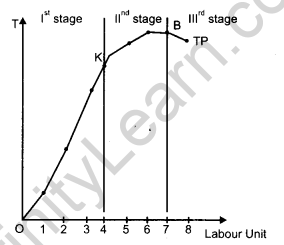
The main reason behind this behaviour of MP is Law of Diminishing Marginal Product. According to the Law of Diminishing Marginal Product, if the employment of variable factor is kept on increasing along with the constant level of the fixed factor, then finally a point will be reached where after, the marginal product of the variable factor will start falling and after this point the marginal product of any additional variable factor can be zero and even be negative.
Question 14.
Explain the conditions of consumer’s equilibrium with the help of the indifference curve analysis. [6]
OR
Explain the three properties of the indifference curves.
Answer:
As per the Indifference Curve Approach, a consumer attains equilibrium at the point where the budget line is tangent to the indifference curve and the IC is convex to the origin at the point of tangency. This optimum point is characterized by the following equality: It is, Absolute value of the slope of the IC = Absolute value of the slope of the budget line.
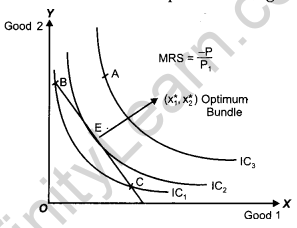
In the above figure, point E depicts consumer’s equilibrium. At this point, the budget line is tangent to the indifference curve IC2. The optimum bundle is denoted by \(\left(x_{1}^{*}, x_{2}^{*}\right)\). This point is the optimum or the best possible consumption bundle, where the consumer is maximizing his satisfaction.
All other points lying on the budget line (such as point B and point C) are inferior to \(\left(x_{1}^{*}, x_{2}^{*}\right)\) as they lie on a lower IC (i.e., IC1). Thus, the consumer will rearrange his consumption and will attempt to reach the equilibrium point, where the marginal rate of substitution is equal to the price ratio.
Let’s suppose that instead of point E, the consumer is at point B. At this point, MRS is greater than the price ratio. In this case, the consumer would tend to move towards point E by giving-up some amount of good 2 in order to consume more units of good 1. The consumer will continue to give-up the consumption of good 2. Until, he reaches the point E, where, MRS becomes equal to the price ratio.
On the other hand, for all other points C, MRS is lesser than the price ratio In this case, the consumer would tend to move towards point E by giving up some amount of good 1 to consume more units of good 2.
Thus, we can conclude that if the consumer is consuming any bundle other than the optimum one, then he would rearrange his consumption bundle in such a manner that the equality between the MRS and the price ratio is established and he attains that state of equilibrium.
OR
There are three properties of Indifference Curve because increase relation between good X Y.
1. Indifference curves are downward slopping to the right: Downward slope of the indifference curve to the right implies that a consumer cannot simultaneously have more of both the goods. An increase in the quantity of one good is associated with the decrease in the quantity of the other good. This is in accordance with the assumption of monotonic preferences.
2. Slope of IC : The Slope of an IC is given by the Marginal Rate of Substitution (MRS). Marginal rate of substitution refers to the rate at which a consumer is willing to substitute one good for each additional unit of the other good.
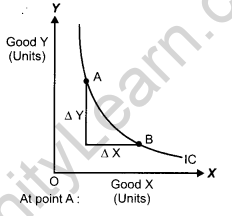
At point A :
Slope of Indifference Curve (MRS) = ∆Y/ ∆X i.e., MRS shows the rate at which the consumer is willing to sacrifice good Y for an additional unit of good X.
3. Shape of Indifference Curve: As we move down along the Indifference curve to the right, the slope of IC (MRS) decreases. This is because as the consumer consumes more and more of one good, the marginal utility of the good falls. On the other hand, the marginal utility of the good which is sacrificed rises. In other words, the consumer is willing to sacrifice less and less for each additional unit of the other good consumed. Thus, as we move down the IC, MRS diminishes. This suggests the convex shape of indifference curve.
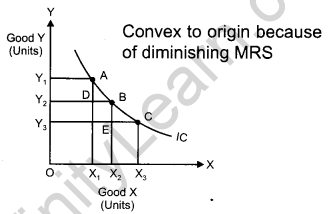
In the above figure, IC is the Indifference Curve.
At point A, MRSxy = AD/AB
At point B, MRSxy = BE / BC
BE/EC< AD/DB
MRS at B < MRS at A, so MRS has fallen.
Question 15.
From the following information about a firm, find the firms equilibrium output in terms of marginal cost and marginal revenue. Give reasons. Also find profit at this output. [6]
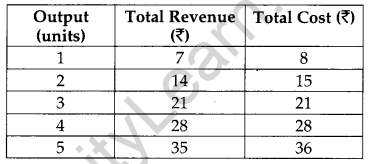
Answer:
According to the MR-MC approach, the firm (or producer) attains its equilibrium, where the following two necessary and sufficient conditions are fulfilled.
1. MR = MC
2. MC must be rising after the equilibrium level of output.
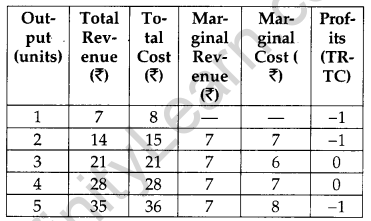
Thus, by looking at the table given above, we can say that the firm is in equilibrium at output equal to 4 units. When output is 4 units, MR = MC (thus, the first condition is satisfied) and MC increases after the 4th unit of output (therefore, the second condition is satisfied).
At output less than 4 units, if the firm produces slightly lesser level of output than 4 units, then the firm is facing price that exceeds the MC. This implies that higher profits can be achieved by increasing the level of output to 4 units. On the other hand, if the firm produces slightly higher level of output than 4 units, then the firm’s MC exceeds its MR, thereby making profits negative. This implies that higher profits can be achieved by reducing the output level to 4 units. Thus, 4 unit of output is the producer’s equilibrium and 4 units of output is the profit maximizing output level, where Price = MC and also MC is rising.
Question 16.
Market of a commodity is in equilibrium. Demand for the commodity “increases”. Explain the chain of effects of this change till the market again reaches equilibrium. Use diagram. [6]
Answer:
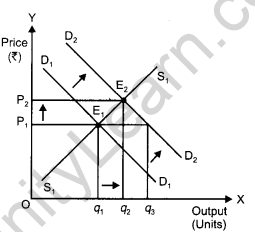
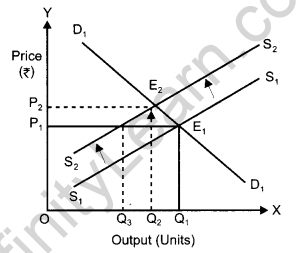
An increase in the demand for the commodity leads to an increase in the equilibrium price and quantity.
Let us understand how it happens: D1D1 and S1S1 represent the market demand and market supply respectively. The initial equilibrium occurs at E1, where the demand and the supply intersect each other. Due to the increase in the demand for the commodity, the demand curve will shift rightward parallely from D1D1 to D2D2, while the supply curve will remain unchanged. Hence, there will be a situation of excess demand, equivalent to (q3 – q1). Consequently, the price will rise due to excess demand. The price will continue to rise until it reaches E2 (new equilibrium), where D2D2 intersects the supply curve The equilibrium price increases from P1 to P2 and the equilibrium output increases from q1 to q2.
Section – B
Question 17.
What are demand deposits? [1]
Answer:
Funds held in an account from which deposited funds can be withdrawn at any time without any advance notice to the depository institution are demand deposits. The depositor can withdraw the required amount from the account through cheques.
Question 18.
What is involuntary unemployment? [1]
Answer:
Involuntary unemployment is a situation when a person who is able and is willing to work does not get work at the going wage rate.
Question 19.
Define marginal propensity to consume. [1]
Answer:
Marginal Propensity to Consume is the ratio of change in the consumption expenditure and change in the disposable income.
Algebraically, MPC = ΔC / ΔY
Question 20.
Define government budget. [1]
Answer:
A government budget is a government document presenting the government’s proposed revenues and spending for a financial year. It also presents the government’s report on the financial performance during the previous fiscal year.
Question 21.
Give meaning of balance of trade. [1]
Answer :
Balance of trade shows the balance of exports and imports of all the physical or visible goods of a country during a given year.
Question 22.
Define externalities. Give an example of negative externality. What is its impact on welfare? [1]
Answer:
An externality is said to occur when the actions of one entity bears an impact on other entities. These externalities can be positive as well as negative. A positive externality is when the action of one person positively affects the others. For instance plantation by a person provides fresh air to the neighbours. Also, it contributes to the environment and at the same time, increases the welfare of the neighbours. Thus, plantation by a person affects the life of the people living in the surrounding areas.
Question 23.
Explain the significance of ‘store of value’ function of money.** [3]
OR
Explain the significance or ‘medium of exchange’ function of money.**
Question 24.
Is the following revenue expenditure or capital
expenditure in the context of government budget? Give reasons. [3]
(i) Expenditure on collection of taxes.
(ii) Expenditure on purchasing computers.
Answer:
(i) Expenditure on collection of taxes is a revenue expenditure. This type of expenditure includes the government expenditure which does not cause any reduction in government liabilities and also does not create assets for the government,
(ii) Expenditure on purchasing computers is a capital expenditure. This expenditure includes that government expenditure, which creates assets for the government.
Question 25.
Explain the meaning of balance of payments deficit. [3]
Answer:
The deficit in the BOP is governed by the balance of autonomous transactions in the BOP. Autonomous items refer to those international economic transactions that are undertaken with the sole motive of earning profit. The BOP would show a deficit if the autonomous receipts are lesser than the autonomous payments. As autonomous receipts implies a receipt of foreign exchange and autonomous payments implies a payment of foreign exchange, so, it can be said that BOP would show a deficit if the foreign exchange receipts are less than foreign exchange payments. In other words, the BOP deficit would be reflected in a depletion of foreign exchange reserves of the country.
Question 26.
Recently Government of India has doubled the import duty on gold. What impact is it likely to have on foreign exchange rate and how? [3]
Answer:
With a rise in the import duty of gold, the import of gold will fall. This reduces the demand
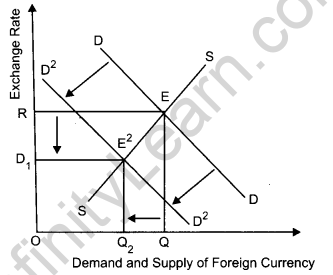
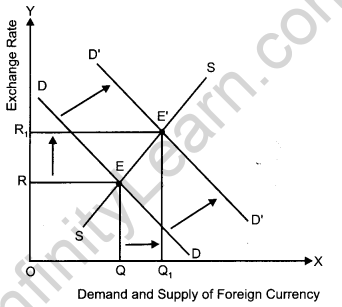
for foreign currency. With the supply of foreign currency remaining same, the foreign exchange rate would fall. This implies appreciation of rupees. This can be explained with the help of the following diagram :
In the diagram, DD and SS are the initial demand curve and supply curve for foreign currency respectively. E is the initial equilibrium point, with OR as the equilibrium exchange rate. A fall in the demand for foreign currencies (due to fall in imports) shifts the demand curve from DD to D’D’. With the shift in demand curve, new equilibrium is established at point E’, where the exchange rate falls from OR to OR1. A fall in the exchange rate implies currency appreciation.
Question 27.
Define money supply and explain its components. [4]
OR
Explain the ‘lender of last resort’ function of central bank.
Answer:
Supply of money refers to the total stock of money (in the form of currency notes and coins) held by the people of an economy at a particular point of time. The following are the components of money:
(i) Curency component: It includes currency notes and coins which are issued by the Monetary Authority of a country, collectively called the currency Component of the money supply. In India, RBI issues the currency notes of various denominations (such as ₹ 2, ₹ 5, ₹ 100, ₹ 500, ₹ 2000) and the Government of India issues currency coins and notes of a denomination less than and equal to ₹ 1.
(ii) Deposit component: The savings or the current account deposits held by the public in various commercial banks of a country. Apart from the currency notes and coins, the stock of money also includes the Saving Deposits and the Current Account Deposits held by the public in various commercial banks.
OR
Lender of last resort function of Central Bank implies that the Central Bank is under the obligation to provide funds against securities to the commercial bank as and when needed by them. When a commercial bank faces financial crisis and fails to obtain funds from other sources, then central bank provides them the financial assistance in the form of credit. This role of the central bank saves the commercial banks from being bankrupt. Thus, the central bank plays the role of a guarantor for the commercial banks and maintains a sound and healthy banking system in the economy.
Question 28.
Calculate investment expenditure from the following data about an economy which is in equilibrium: [4]
National income = 1000
Marginal propensity to save = 0.25
Autonomous consumption expenditure = 200.
Answer:
We know,
Y = C + I
C = \(\overline{\mathbf{c}}\) + cY
∴ Y = \(\overline{\mathbf{c}}\) + cY +1
Where c = autonomus consumption (200)
c = marginal propensity to consume
(1 – MPS = 1 – 0.25 = 0.75)
Y = national tricorne = ₹ 1000
I = Investment expenditure by putting the value
1000 = 200 + 0.75 × 1000 + I
I = 1000 – (200 + 750)
= 1000 – 950
I = ₹ 50
Question 29.
Government raises its expenditure on producing public goods. Which economic value does it reflect? Explain.** [4]
Question 30.
Calculate national income and gross (national disposable income)** from the following : [6]
Answer:
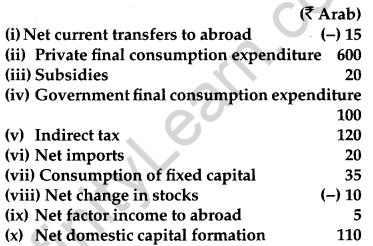
National Income = Private Final Consumption Expenditure + Government Final Consumption Expenditure – Net Imports + (Net Domestic Capital Formation + Depreciation) – Depreciation – (Indirect Taxes – Subsidies) – Net Factor Income to Abroad or,
National Income (NNPFC) = 600 + 100 + (-20) + (110 + 35) – 35 – (120 – 20) – 5 = ₹ 685 Arab.
Question 31.
Giving reason explain how should the following be treated in estimating gross domestic product at market price? [6]
(i) Fees to a mechanic paid by a firm.
(ii) Interest paid by an individual on a car loan taken from a bank.
(iii) Expenditure on purchasing a car for use by a firm.
Answer:
(i) Fees paid to a mechanic by a firm will be included while estimating the gross domestic product at market price. This is because the fees in being paid in return for the services offered by the mechanic. Thus, as GDPMP includes the market value of all the goods and services produced in a country, it will be included.
(ii) Interest paid by an individual on a car loan taken from a bank will be included while estimating the gross domestic product at market price. This is because it is an income for the bank. Thus, it will be a part of GDPMP.
(iii) Expenditure on purchasing a car for use by a firm will be included while estimating the gross domestic product at market price. This is because the car is being purchased by the firm for its usage and not for other purposes.
Question 32.
Explain national income equilibrium through aggregate demand and aggregate supply. Use diagram. Also explain the changes that take place in an economy when the economy is not in equilibrium. [6]
OR
Outline the steps required to be taken in deriving saving curve from the given consumption curve. Use diagram.
Answer:
Aggregate Demand and Aggregate Supply approach (AD and AS approach). Under this approach, the equilibrium level of income is determined at the point where Aggregate Demand (AD) is equal to Aggregate Supply (AS).
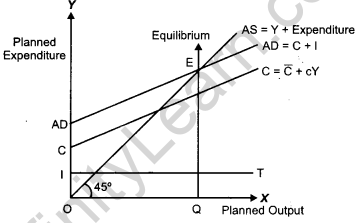
In this diagram, consumption curve is depicted by C and the investment curve is depicted by the horizontal straight line parallel to the output/ income axis. Summing-up the investment curve and consumption curve, we get the Aggregate Demand curve represented by AD = C + I. The Aggregate Supply curve is represented by the 45° line. Throughout this line, the planned expenditure is equal to the planned output. The point E is the equilibrium point, where the planned level of expenditure (AD) is equal to the planned level of output (AS). Accordingly, the equilibrium level of output (income) is OQ.
In case, if AD > AS, then it implies a situation, where the total demand for goods and services is more than the total supply of the goods and services. This implies a situation of excess demand. Due to the excess demand, the producers draw down their inventory and increases production. The increase in production requires hiring more factors of production, thereby increases employment level and income. Finally, the income will rise sufficiently to equate the AD with AS, thus the equilibrium is restored back.
On the other hand, in case, AS > AD, then it implies a situation, where the total supply of ‘ goods and services is more than the total demand for the goods and services. This implies a situation of deficit demand. Due to the deficit demand, the producers experience pilling-up of stock of unsold goods, i.e., inventory accumulation. This would force the producers to cut-back the production, thereby results in the reduced employment of factors of production. This leads to fall in the income and output. Finally, the income and output will fall sufficiently to equate the AD with AS, thus the equilibrium is restored back.
OR
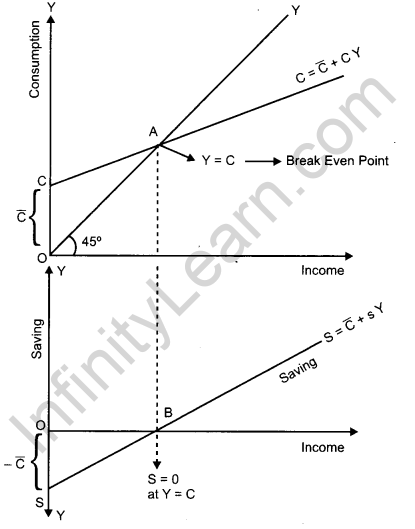
The following figure is the consumption curve. The 45° line is the aggregate supply curve. At point A, consumption = income i.e., (Y = C) represents the autonomous consumption i.e., consumption at zero level of income. Steps for derivation of supply curve from consumption curve is as follows :
(i) Corresponding to in the consumption function we have-in the saving function. That is, there are negative savings equal to autonomous consumption at Y = 0. This is represented by S on the negative axis in the lower panel.
(ii) At point A (Y = C). This implies that all the income is spent on consumption expenditure. Thus savings equal to zero. This is shown as S = 0 in lower panel. This point is also known as the Break-even point.
(iii) Beyond the break-even point, by connecting points S and B we derive the straight upward sloping saving curve.
(iv) SS is the required saving curve.


CBSE Previous Year Question Papers Class 12 Economics 2014 Delhi Set – II
Note: Except for the following questions, all the remaining questions have been asked in previous set.
Section – A
Question 3.
Define budget line. [1]
Answer:
A budget line is a line which shows different combination of two goods which a consumer can attain at his given income and market price of the goods.
Question 5.
What is meant by cost in economics? [1]
Answer:
Cost refers to the expenditure incurred by a producer on factor and non-factor inputs for a given amount of output of a commodity.
Question 8.
Price elasticity of demand of a good is (-)l. When its price per unit falls by one rupee, its demand rises from 16 to 18 units. Calculate the price before change. [3]
Answer:
Given,
Q1 = 16
Q2 = 18
DP = -1
We know, DQ = Q2 – Q1 = 18 – 16 = 2
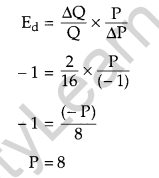
Therefore, price before change is ₹ 8
Question 13.
Explain the change in demand of a good on account of change in prices of related goods. [4]
Answer:
Quantity demanded of a good depends on the price of other goods (i.e., related goods). Any two goods are considered to be related to each other, when the demand for one good changes in response to the change in the price of the other good. The related goods can be classified into following two categories.
1. Substitute Goods
Substitute goods refer to those goods that can be consumed in place of each other. In other words, they can be substituted for each other. For example, tea and coffee, Colgate and pepsodent, cello pens and reynolds pen, etc. In case of substitute goods, if the price of one good increases, the consumer shifts his demand to the other (substitute) good 1. e., rise in the price of one good result in a rise in the demand of the other good and vice-versa.
For example, if price of tea increases, then the demand for tea will decrease. As a result, consumers will shift their consumption towards coffee and the demand for coffee will increase. (Price of Tea t ⇒ Demand for Coffee ↑). It should be noted that the demand for a good moves in the same direction as that of the price of its substitute. If PT increases ↑⇒ DT decreases ⇒ DC increases ⇒ Tea and coffee are substitute goods.
2. Complementary Goods
Complementary goods refer to those goods that are consumed together. The joint consumption of these goods satisfies wants of the consumer. For example : Tea and sugar, ink pen and ink, printer and paper, etc. In case of complementary goods, if the price of one good increases then a consumer reduces his demand for the complementary good as well, i.e., a rise in the price of one good results in a fall in demand of the other good and vice-versa.
For example, sugar and tea are complementary goods. Since, sugar and tea is consumed together, so a rise in price of tea reduces the demand of sugar and vice-versa. It should be noted that demand for a good moves in the opposite direction of the price of its complementary goods. (Price of tea ↑ ⇒ demand for sugar ↓) If P Tea increases ↑⇒ DTea decreases ↓ ⇒ DSugar decreases ↑⇒ Tea and Sugar are complementary goods.
Section – B
Question 18.
What is ‘current account deficit’ in the balance of payments? [1]
Answer:
When export of visible items, invisible items and unilateral transfers are less and import of these items are more, it leads to current account deficit.
OR
When foreign exchange receipts in current account fall, as compared to foreign exchange payments, it is known as current account deficit.
Question 24.
Visits of foreign countries for sightseeing etc., by the people of India is on the rise. What will be its likely impact on foreign exchange rate and how? [3]
Answer:
With the increase in the foreign visit by the people India, the demand for foreign currency increases. With the supply of foreign currency remaining same, the foreign exchange rises, implying a depreciation of rupees. This can be explained diagrammatically as follows.
In the diagram, DD and SS are the initial demand curve and supply curve for foreign currency respectively. E is the initial equilibrium point, with OR as the equilibrium exchange rate. An increase in the demand for foreign currencies shifts the demand curve from DD to D’D’ With the shift in demand curve, new equilibrium is established at point E’ where the exchange rate rises from OR to OR1 and the demand and supply of foreign currencies rises from OQ to OQ1. A rise in the exchange rate implies currency depreciation.
Question 29.
Calculate autonomous consumption expenditure from the following data about an economy which is in equilibrium. [4]
National income = 1200
Marginal propensity to save = 0.20
Investment expenditure = 100
Answer:
We have,
Y = C + I .
where,
I is investment expenditure which is given as 100. Y is income which is given as 1200 and, C = \(\overline{\mathrm{C}}\) + cY here, \(\overline{\mathrm{C}}\) is autonomous consumption expenditure is marginal propensity to consumer, c = 1 – marginal propensity to consume (mps) so, c = 1 – 0.20 = 0.80. Thus, putting the values in the equation, Y = \(\overline{\mathrm{C}}\) + cY + I or, 1200 = \(\overline{\mathrm{C}}\) + 0.80 × 1200 + 100 or, \(\overline{\mathrm{C}}\) = 1200 – 1060 = 140. Thus, autonomous consumption expenditure is 140.
Question 31.
Calculate ‘net national product at factor cost and ‘private income**’ from the following: [6]
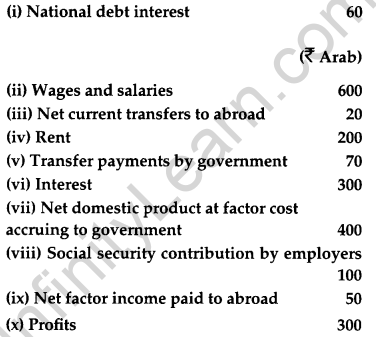
Answer:
NNPFC = Wages and salaries + Employers contribution to social security + Rent + Interest + Profit – Net Factor Income to Abroad or,
NNPFC = 600 + 100 + 200 + 300 + 300 – 50 = ₹ 1,450 Arab.
CBSE Previous Year Question Papers Class 12 Economics 2014 Delhi Set – III
Note: Except for the following questions, all the remaining questions have been asked in previous set.
Section – A
Question 1.
Define marginal revenue. [1]
Answer:
Marginal Revenue (MR) is an addition to the Total Revenue (TR) from selling an additional unit of output.
Question 5.
Define indifference map. [1]
Answer:
It is a set of indifference curves, drawn in graph called IDmap corresponding to different satisfaction levels of a consumer. A higher indifference curve represents higher level of satisfaction.
Question 10.
A consumer buys 30 units of a good at a price of ₹ 10 per unit. Price elasticity of demand for the good is (-1). How many units the consumer will
buy at a price of ₹9 per unit? Calculate. [3]
Answer:
Given, Q1 = 30, Q2 = ?, P1 = ₹ 10, P2 = ₹ 9
and Ed = -1
Therefore, DQ = Q2 – Q1 and DP = P2 – P1 = ₹ (-1)
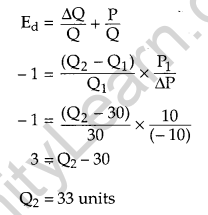
Therefore, the consumer will buy 33 units of the good at a price of ₹ 9.
Question 11.
What is market demand for a good ? Name the factors determining market demand. [4]
Answer:
Market demand for a good is the sum total of demands of all the consumers in a market at a particular price. Factors determining market demand are:
- Market Price of Good: Other things remaining constant, as the market price of a good rises (or falls), the quantity demanded of the good falls (or rises).
- Market Price of Other Goods: Quantity demanded of a good also depends on the market price of other goods (i.e., related goods). The related goods can be classified into following two categories.
- Substitute Goods: In case of substitute goods, rise in the price of one good results in a rise in the demand of the other good and vice-versa.
- Complementary Goods: In case of complementary goods, a rise in the ‘ price of one good results in a fall in demand of the other good and vice-versa.
- Income of the consumer: Change in the income of the consumer also affects the market demand for goods. The effect of change in income on the market demand depends on the type of the good.
The market demand for normal goods shares a positive relationship with consumer’s income. The market demand for inferior goods (such as coarse cereals) shares a negative relationship with consumer’s income.
The market demand for giffen goods also shares a negative relationship with the income. - Consumer’s tastes and preferences: Other things being equal, if all the consumers prefer a commodity over other, then the market demand for that commodity increases and vice- versa.
- Population size: Number of consumers in the market. The market demand for a commodity is also affected by the population size. Other things being equal, an increase in the population size increases the market demand of a commodity and a decrease in population decreases the market demand of a commodity.
- Distribution of Income: If distribution of income in a society is fair and equal, then demand for a commodity is more compared to a situation with unequal distribution of income.
Question 15.
Market for a product is in equilibrium. Supply of the product “decreases.” Explain the chain of effects of this change till the market again reaches equilibrium. Use diagram. [6]
Answer:
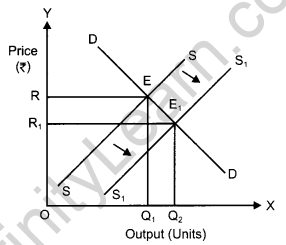
Decrease in the supply of the commodity leads to an increase in the equilibrium price and a fall in the equilibrium quantity. Let us understand how it happens: D1D1 and S1S1 represents the market demand and market supply respectively. The initial equilibrium occurs at E1, where the demand and the supply intersect each other. Due to the decrease in the supply of the commodity, the supply curve will shift leftward parallel from S1S1 to S2S2, while the demand curve will remain unchanged. Hence, at the original price (P1), there will be a situation of excess demand, equivalent to (q3 – q1). Consequently, the price will rise due to excess demand. The price will continue to rise until it reaches, E2 (new equilibrium), where D1D1 intersects the supply curve S2S2. The equilibrium price rises from P1 to P2 and the equilibrium output falls from q1 to q2.
Section – B
Question 17.
Define aggregate supply ? [1]
Answer:
Aggregate supply refers to the value of all final goods and services produced by all the production unit in an economy in a particular period of time.
Question 19.
What is ‘devaluation’? [1]
Answer:
A deliberate downward adjustment in the value of a country’s currency, relative to another country’s currency by the government, is called devaluation of domestic currency.
Question 23.
How does giving incentives for exports influence foreign exchange rate? Explain. [3]
Answer:
The incentives for exports boosts exports for the country. As a result of increase in exports the supply of foreign currency in the country increases. With demand remaining the same, this results in a fall in the exchange rate implying currency appreciation. This can be explained diagrammatically as follows,
With the rise in exports the supply of foreign currency increases. In the diagram DD and SS are the initial demand curve and supply curve for foreign currency respectively. E is the initial equilibrium point, with OR as the equilibrium exchange rate. Rise in the supply of foreign currency would shift the supply curve from SS to S’S’. With the shift in supply curve, the new equilibrium is established at point E’, where the exchange rate falls from OR to OR1 and the demand and supply of foreign currency rises to OQ2. This represents a case of currency appreciation.
Question 27.
Calculate marginal propensity to consume from the following data about an economy which is in equilibrium: [4]
National Income = 1500
Autonomous consumption expenditure = 300
Investment expenditure = 300
Answer:
We know that in equilibrium,
Y = C + I where,
I is investment expenditure, given as 300
Y is national income, given as 1500 and, C = \(\overline{C}\) + cY
here, \(\overline{C}\) is autonomous consumption expenditure, given as 300, c is marginal propensity to consume. Thus, putting the values in the equation, we have Y = \(\overline{C}\) + cY + I.
or, 1500=300 + c x 1500 + 300
or, c = \(\frac{1500-600}{1500}\) = 0.6.
Thus, marginal propensity to consume is 0.6.
Question 32.
Calculate net domestic product at factor cost and (net national disposable income**) from the following:
Answer:
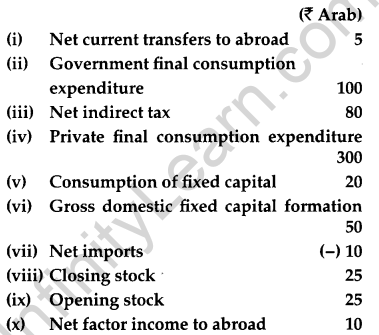
National Domestic Income at Factor Cost = Private Final Consumption Expenditure + Government Final Consumption Expenditure – Net Imports + (Gross Domestic Fixed Capital Formation + Closing stock – Opening stock) – Depreciation – Net Indirect Taxes or,
National Income (NDPFC) = 300 + 100 – (-10) + (50 + 25 -25) – 20 – 80 = ₹ 360 Arab.
