
Table of Contents
CBSE Previous Year Question Papers Class 12 Economics 2015 Delhi
Time allowed : 3 hours
Maximum marks: 70
** Answer is not given due to change in the present syllabus
CBSE Previous Year Question Papers Class 12 Economics 2015 Delhi Set – I
Section – A
Question 1.
Give equation of Budget Line. [1]
Answer:
The equation for budget line is as follows.
P1X1 + P2X2 = M Where,
P2 represents price of good 1 X1 Quantity of good 1
P2 represents price of good 2 X2 Quantity of good 2
M represents income of the consumer
Question 2.
When income of the consumer falls the impact on price-demand curve of an inferior good is : (choose the correct alternative) [1]
(a) Shifts to the right.
(b) Shifts to the left.
(c) There is upward movement along the curve.
(d) There is downward movement along the curve.
Answer:
(a) Shifts to the right.
Question 3.
If Marginal Rate of Substitution is constant throughout, the Indifference curve will be : (choose the correct alternative. [1]
(a) Parallel to the x-axis.
(b) Downward sloping concave.
(c) Downward sloping convex.
(d) Downward sloping straight line.
Answer:
(a) Downward sloping straight line.
Question 4.
Giving reason comment on the shape of Production Possibilities Curve based on the following schedule: [3]
| Good X (units) | Good Y (units) |
| 0 | 10 |
| 1 | 9 |
| 2 | 7 |
| 3 | 4 |
| 4 | 0 |
Answer:
The PPC would be concave in shape. This is because of the increasing opportunity cost. ‘With increase each additional unit of production of good X of the amount of good Y that must be sacrificed increases. For example, as the production of good X moves from first unit to second unit, 2 units of good Y must be sacrificed (9 – 7). Further, as the production moves from second unit to third unit, the units of good Y that must be sacrificed increases to three. Thus, the opportunity cost of producing one additional unit of good X goes on increasing. This increasing opportunity cost gives rise to concave shape of PPC.
Question 5.
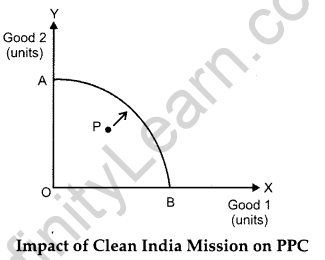
What will be the impact of recently launched ‘Clean India Mission’ (Swachh Bharat Mission) on the Production possibilities curve of the economy and why? [3]
OR
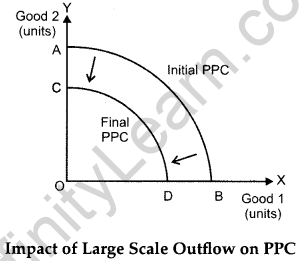
What will likely be the impact of large scale outflow of foreign capital on Production Possibilities curve of the economy and why?
Answer:
The ‘Clean India Mission’ (Swachh Bharat Mission) will lead to better waste- management technique. Consequent to this, there will be drastic reduction in the number of people falling ill. Both these factors will lead to better and efficient utilisation of existing resources of an economy. Accordingly, the economy will move higher and closer to initial PPC. This movement is being depicted in the below graph with the help of the arrow from point P.
OR
The large scale outflow of foreign capital will lead to a decrease in the availability of resources, thereby shifting the Production Possibility Curve (PPC) parallelly to the left from AB to CD as shown in the following diagram. Hence, we can say that leftward shift of PPC results in fall in output and resources.
Question 6.
The measure of price elasticity of demand of a normal good carries minus sign while price elasticity of supply carries plus sign. Explain why? [3]
Answer:
The measure of price elasticity of demand carries a minus sign because it shows an inverse relationship between price and quantity demanded i.e., other things remaining constant, as the price of a good rises or falls, the quantity demanded of the good falls (or rises). On the other hand, price elasticity of supply carries plus sign as there exists a positive relationship between the supply of a commodity and its price. To put’ in other words, when the price of a good rises (or falls), then the quantity supplied will increase (or decrease), other things remaining unchanged.
Question 7.
There are large number of seller in a perfectly competitive market. Explain the significance of this feature. [3]
Answer:
There exists a large numbers of buyers and sellers in a perfect competitive market. The number of sellers is so large that no individual firm owns the control over the market price of the commodity. Due to the existence of large number of sellers in the market, there exists perfect and free competition in the market. The firm acts as a price taker. That is, the firms have no control over the existing market price and cannot influence it. If an individual firm raises its price, then it will lose all its buyers to other firms and vice-versa. Thus, firms have no role to play other than supplying the required output at the existing market price and therefore a firm is a price taker and not a price maker.
Question 8.
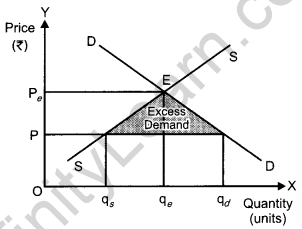
Explain the effects of ‘maximum price ceiling’ on the market of a good. Use diagram. [3]
Answer:
Price ceiling is the legislated or government imposed maximum level of price that can be charged by the seller. Since price ceiling is lower than the equilibrium price (OPe), thus the imposition of the price ceiling leads to excess demand as shown in the diagram below.
The following are the consequences and effects of price ceiling.
Excess demand: Due to artificially lowering the price, the demand becomes comparatively higher than the supply. This leads to the emergence, of the problem of excess demand.
Enhances welfare: The imposition of the price ceiling ensures the access of the necessity goods within the reach of the poor people. This safeguards and enhances the welfare of the poor and vulnerable sections of the society.
Fixed quota: Each consumer gets a fixed quantity of good (as per the quota). The quantity often falls short of meeting the individual’s requirements. This further leads to the problem of shortage and the consumer remains unsatisfied.
Inferior goods: Often it has been found that the goods that are available at the ration shops are usually inferior goods and are adulterated and infiltrated.
Black marketing: The needs of a consumer remain unfulfilled as per the quota laid by the government. Consequently, some of the unsatisfied consumers get ready to pay higher price for the additional quantity. This leads to black-marketing and artificial shortage in the market.
Question 9.
A consumer spends ₹ 1000 on a good price at ₹ 8 per unit. When price rises by 25 percent, the consumer continues to spend same amount on the good. Calculate price elasticity of demand by percentage method. [4]
Answer:
Given:
Initial Total Expenditure (TE0) = ₹ 1000
Final Total Expenditure (TE1) = ₹ 1000
Initial Price (P0) = ₹ 8
Percentage change in price = +25%
Percentage change in price = \(\frac{\mathrm{P}_{1}-\mathrm{P}_{0}}{\mathrm{P}_{0}} \times 100\)
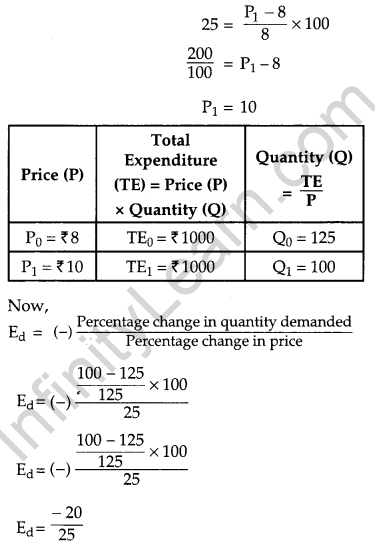
∴ Ed = 0.8
Thus, the price elasticity of demand is 0.8
Question 10.
Define cost. State the relation between marginal cost and average variable cost. [4]
OR
Define revenue. State the relation between marginal revenue and average revenue.
Answer:
Cost or cost of production refers to the expenditures incurred or payments made by a firm to various factors of production (such as, land, labour, capital and entrepreneur) and also non-factors of production (such as, raw materials, etc.)
Relationship between AVC and MC
(1) When AVC is falling, MC falls at a faster rate and stays below AVC curve.
(2) When AVC is rising, MC rises at a faster rate and remains above AVC curve.
(3) When AVC is at minimum point (y), MC is equal to AVC.
MC curve cuts AVC curve at its minimum point.
(4) The minimum point of.MC curve (x) will always lie left to the minimum point of AVC curve (y).
(5) AVC and MC both are derived from TVC.

OR
Revenue is the money income for a firm which it receives from the sale of goods produced. In other words, revenue refers to the sale proceeds or sales receipts.
Relationship between MR and AR
The relationship between AR and MR can be studied under two forms of market-under Perfect Competition market and under Imperfect Competition market.
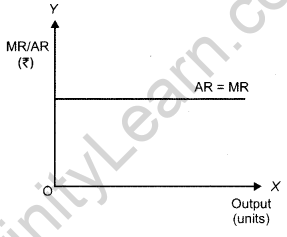
1. Under perfect competition market: AR equals MR throughout all output levels. Graphically, MR curve is a straight horizontal line parallel to the x-axis and coincides with the AR curve.
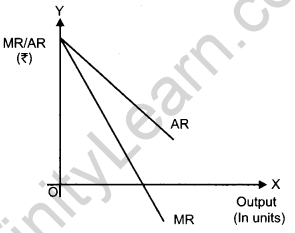
2. Under imperfect competition market : As output increases both AR and MR falls. However, AR remains greater than MR at all levels of output. Also, when AR curve becomes zero, then the MR curve is negative. Graphically, both AR curve and MR curve are downward sloping but the AR curve remains above the MR curve.
Question 11.
A consumer consumes only two goods X and Y both priced at ₹ 3 per unit. If the consumer chooses a combination of these two goods with Marginal Rate of Substitution equal to 3, is the consumer in equilibrium ? Give reasons. What will a rational consumer do in this situation? Explain. [6]
OR
A consumer consumes only two goods X and Y whose prices are ₹ 4 and ₹ 5 per unit respectively. If the consumer chooses a combination of the two goods with marginal utility of X equal to 5 and that of Y equal to 4, is the consumer in equilibrium? Give reason. What will a rational consumer do in this situation? Use utility analysis.
Answer:
At the point of consumer equilibrium the following equality should be met:
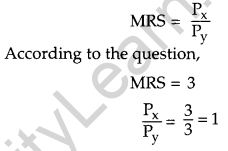
So, MRS is greater than the price ratio. Thus, to reach the equilibrium point a rational consumer would decrease the consumption of good y.
OR
According to the utility approach, a consumer reaches equilibrium where the following equality is met.
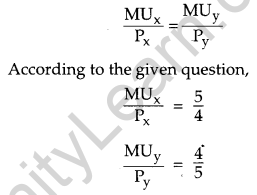
So, \(\frac{\mathrm{MU}_{\mathrm{x}}}{\mathrm{P}_{\mathrm{x}}}\) is greater than \(\frac{\mathrm{MU}_{\mathrm{y}}}{\mathrm{P}_{\mathrm{y}}}\) . Thus, to reach the equilibrium, a rational consumer would increase the consumption of good x and decrease that of good y.
Question 12.
State the different phases of changes in Total Product and Marginal Product in the Law of Variable Proportions. Also show the same in a single diagram. [6]
Answer:
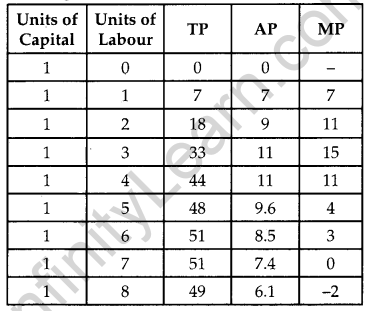
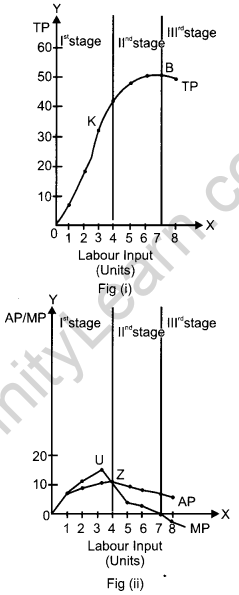
The different phases of changes in Total Product (TP) and Marginal Product (MP) can be understood with the help of Law of Variable Proportions. As per this law, if more and more of variable factor (labour) is combined with the same quantity of fixed factor (capital), then initially the total product will increase but gradually after a point, the total product will become smaller and smaller. The following are the three phases (stages) of the Changes in the two variables.
1st Stage: Increasing returns to a factor This stage starts from the origin point 0 and continues till the point of inflexion (K) on the TP curve. During this phase, TP increases at an increasing rate and is also accompanied by rising MP curve (in figure ii). The MP curve attains its maximum point (U) corresponding to the point of inflexion. Throughout this stage, AP continues to rise.
IInd Stage: Diminishing returns to a factor
This stage starts from point K and continues till point B on the TP curve. During this stage, the TP increases but at a decreasing rate and attains its maximum point at B, where it remains constant. On the other hand (in the figure (ii)), the MP curve continues to fall and cuts AP from its maximum point Z, where MP equals AP. When TP attains its maximum point, corresponding to it, MP becomes zero. AP, in this stage initially rises, attains its maximum point at Z and thereafter starts falling.
IIIrd Stage: Negative Returns to a Factor This stage begins from the point B on the TP curve. Throughout this point, TP curve is falling and MP curve is negative. Simultaneously, the AP curve continues to fall and approaches the x-axis (but does not touch it). Like the first stage, this stage is also known as non-economic zone as any rational producer would not operate in this zone. This is because the addition to the total output by the additional labour unit (i.e. marginal product) is negative. This implies that employing more labour would not contribute anything to the total product but will add to cost of the production in form of additional wage. Hence, the cost of the additional labour input is greater the benefit of employing it.
The law of variable proportion can be easily understood with the help of following schedule and diagram.
Question 13.
Why is the equality between marginal cost and marginal revenue necessary for a firm to be in equilibrium? Is it sufficient to ensure equilibrium? Explain. [6]
Answer:
According to MR-MC approach, the firm (or producer) will attain equilibrium where the following two necessary and sufficient conditions are fulfilled.
Case A: If Price (MR) > MC
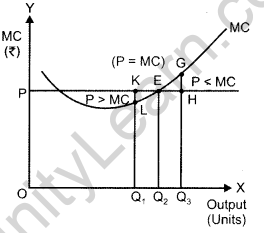
At output OQ1, price is KQ1 and the marginal cost is LQ1, such that KQ1 > LQ1. Therefore, OQ1 is not the profit maximising output. This is due to the fact that the firm can increase its profit by increasing the production of output to OQ2.
Case B: If Price (MR) < MC
At output OQ3, price is HQ3 and the marginal cost is GQ3, such that HQ3 < GQ3. Therefore, OQ3 is not the profit maximising output. This is due to the fact that the firm can increase its profit by reducing its output level to OQ2.
Thus, we can conclude that at profit maximisation output, the equilibrium price (or MR) must be equal to the MC curve and it cannot be greater or lesser than the MC curve. The equality of MR and MC is only the necessary condition, The sufficient condition is that the MC should be rising at the point of intersection with MR.
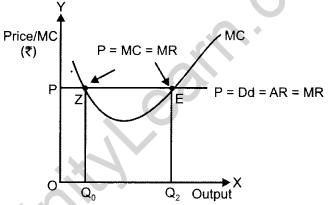
In the figure, the MC curve cuts the price line (or MR) at two different points i.e., at Z’ and E’. The first order condition of profit maximisation, i.e., Price (or MR) MC is fulfilled at both of these points. Now let us evaluate which of the following two cases fulfill the second order condition of profit maximisation.
Case A: At point’Z’
At point ‘Z’, price is equal to MC but MC is falling and is negatively sloped. At this point, any output level slightly more than the OQ0, the firm is facing price that exceeds the MC. This implies that, the profit can be maximised by increasing output level beyond OQ0. Therefore, OQ0 is not a profit maximisation output.
Case B: At point ‘E’
To the left of the point ‘E’, if the firm produces slightly lesser level of output than OQ2, then the firm is facing price that exceeds the MC. This implies that higher profits can be achieved by increasing the level of output to OQ2. On the other hand, to the right of the point ‘E’, if the firm produces slightly higher level of output than OQ2, then the firm is facing price that falls short of the MC. This implies that higher profits can be achieved by reducing the output level to OQ2. Thus, the point E is the producer’s equilibrium and OQ2 is the profit maximizing output level, where Price = MC and also MC curve is rising.
Question 14.
Market for a good is in equilibrium. The demand for the good ‘increases’. Explain the chain of effects of this change. [6]
Answer:
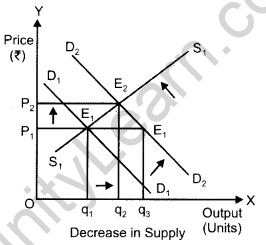
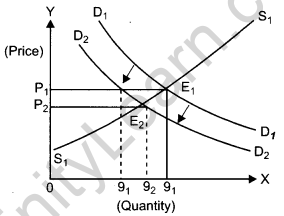
Suppose D1D1 and S1S1 are the initial market demand curve and market supply curve, respectively. The initial equilibrium is established at point E1, where the market demand curve and the market supply curve intersects each other. Accordingly, the equilibrium price is OPx and the equilibrium quantity demanded is Oq1.
Now, assume that market demand increases (may be due to an increase in the consumer’s income). This shifts the market demand curve parallel rightwards to D2D2 from D1D1. While the market supply curve remains unchanged at S1S1. This imples that at the initial price OP1. There exist excess demand equivalent to (Oq1 – Oq3) units. This excess demand will increase competition among the buyers and they will now be ready to pay a higher price to acquire more units of good. This will further raise the market price. The rise in the price will continue till the market price becomes OP2. The new equilibrium is established at point E2 where the new demand curve D2D2 intersects the supply curve S1S1. Observe that at the new equilibrium both market price and quantity demanded are more than the initial equilibrium. The new equilibrium quantity supplied Oq2 and the new equilibrium price is OP2 Hence, an increase in demand with supply remaining constant, results in rise in the equilibrium price as well as the equilibrium quantity.
To summarise,
Increase in demand ⇒ Excess demand at the existing price Competition among the buyers ⇒ Rise in the price level ⇒ New equilibrium ⇒ Rise in both quantity demanded as well as price.
Section – B
Question 15.
What is ‘aggregate supply’ in macroeconomics? [1]
Answer:
Aggregate supply refers to the total output produced in the country or the total national product of the country at a given level of employment.
Question 16.
The value of multiplier is : (choose the correct alternative) [1]
Answer:
(b) \(\frac{1}{\mathrm{MPS}}\)
Question 17.
Borrowing in government budget is: (choose the correct alternative) [1]
(a) Revenue deficit
(b) Fiscal deficit
(c) Primary deficit
(d) Deficit in taxes
Answer:
Borrowing in the government is the fiscal deficit. The fiscal deficit basically shows the borrowing requirement of a country. It is defined as the excess of government expenditure over government revenue.
Hence, the correct answer is option (b).
Question 18.
The non-tax revenue in the following is: (choose the correct alternative) [1]
(a) Export duty
(b) Import duty
(c) Dividends
(d) Excise
Answer:
The non-tax revenue is dividends. This is because the import duty, export duty and excise are different kinds of tax revenues for the government. Hence, the correct answer is option (c).
Question 19.
Other things remaining unchanged, when in a country the price of foreign currency rises, national income is : (choose the correct alternative) [1]
(a) Likely to rise
(b) Likely to fall
(c) Likely to rise and fall both
(d) Not affected
Answer:
When the prices of foreign currency rises, the national income is likely to rise. This is because rise in foreign prices will lead to increase in the one of the components of national income i.e. net exports. That is, exports will increase and imports will decrease (as imports have become expensive), this will ultimately lead to increase in national income.
Hence, the correct answer is option (a).
Question 20.
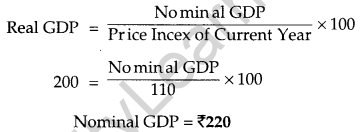
If Real GDP is ₹ 200 and Price Index (with base = 100) is 110, calculate Nominal GDP. [3]
Answer:
We know,
Question 21.
Name the broad categories of transactions recorded in the ‘capital account’ of the Balance of Payments Accounts. [3]
OR
Name the broad categories of transactions recorded in the ‘current account’ of the Balance of Payments Accounts.
Answer:
The following are the three broad categories of transactions recorded under capital account of BOP.
1. Foreign direct investment (FDI) and portfolio investment: Foreign Direct Investment refers to the investment in the assets of a foreign country. By investing, the government or any resident of domestic country owns the control over the asset of the foreign country. On the contrary, Portfolio Investment refers to the investment in the assets of a foreign country without any control over that asset.
FDI and Portfolio Investment cause an inflow of foreign exchange into the country. Thus, they are recorded as positive items in the Capital Account of BOP. It should also be noted that FDI and Portfolio Investment are the non-debt creating capital transactions.
2. Loans and Borrowings: Loans and borrowings by a country from the foreign countries or from the international money market are recorded in the Capital Account of the BOP. These borrowings can be in the form of commercial borrowings or in the form of assistance. When a country borrows with the consideration of assistance, the transaction would involve a lower rate of interest as compared to the prevailing market rate of interest. As against this, commercial borrowings involve open market rate of interest. Loans and borrowings result in inflow of foreign exchange into the country. Hence, they are recorded as positive items in the Capital Account of BOP. Unlike FDI and Portfolio Investments, loans and borrowings are debt creating capital transactions.
3. Banking Capital Transactions: Another form of Capital Account transactions are banking capital transactions. Such transactions refer to the transactions of external financial assets and liabilities of the commercial banks and co-operative banks that operate as authorised dealers in the foreign exchange market.
OR
The following are the broad categories of transactions recorded under current account of BOP.
1. Export and import of goods : The transactions of a country in the form of export and import of goods is recorded in the current account of the BOP. This record of export and import of goods is also called the ‘Balance of Visible Trade’. The export of goods is recorded as a positive item in the Current Account of BOP. This is because exports result in the inflow of foreign exchange into the country. On the other hand, imports of goods are recorded as negative items in the Current Account of BOP, as they result in an outflow of the foreign exchange from the country.
2. Export and import of services: Another component of the Current Account is the export and import of services. The record of export and import of services is also called the ‘Balance of invisible trade’. Similar to the export of goods, export of services is also recorded as positive items in the Current Account of BOP. As against this, the import of services is recorded as negative items in the Current Account of BOP. The following are some of the major services that are included in the Current Account of BOP.
(a) Shipping services, insurance and banking services, etc.
(b) Income from investment (i.e. income from profits and dividends)
(c) Foreign travel
(d) Miscellaneous transactions such as royalties, consultancy services, telephone services, etc.
3. Unilateral Transfers: Unilateral transfers refer to the one-sided transfers such as gifts, donations, grants from foreign governments, etc. A country makes such transfers to the rest of the world as well as receives transfers from the rest of the world. Receipts of unilateral transfers are recorded as positive items in the Current Account of BOP, while payments of unilateral transfers are recorded as negative items in the Current Account of BOP.
Question 22.
Where will sale of machinery to abroad be recorded in the Balance of Payments Accounts? Give reasons. [3]
Answer:
Sale of machinery to abroad (exports) will be recorded as positive item in the current account of BOP, The current account of BOP is that account which maintains the records of imports and exports of goods and services as well as record of unilateral transfers. Those transactions that result in an inflow of foreign exchange in the country are recorded as positive items in the current account of BOP. On the other hand, those items that lead to an outflow of foreign exchange from the country are recorded as negative items in the current account of BOP. Therefore, as sale of machinery abroad leads to an inflow of foreign exchange in the country it will be recorded as a positive item in the current account of BOP.
Question 23.
Explain the ‘bank of issue’ function of the central bank. [4]
OR ‘
Explain ‘Government’s Bank’ function of central bank.
Answer:
Bank of issue function of central bank implies that the central bank of a country has the exclusive authority to issue the currency (notes + coins). The currency issued by the central bank is known as ‘legal tender money’ i.e. the value of such currency is backed by the central bank. However, the currency issued by the central bank is its monetary liability. In other words, the central bank is obliged to back the currency issued by it by assets such as gold coins and bullions, foreign exchange. In addition to issuing currency to the general public, the central bank also issues currency to the central government of the country. That is, the central government if required, can sell its securities to the central bank and in return gets the required cash currency.
OR
Central bank acts as a banker and financial advisor to the government. As a banker to the government, it performs the following functions.
(a) It manages the account of the government.
(b) It accepts receipts from the government and makes payment on behalf of it.
(c) It grants short-term loans and credit to the government.
(d) It performs the task of managing the public debt.
(e) The central bank advises the government on all the banking and financial related matters.
Question 24.
Government of India has recently launched ‘Jan-Dhan Yojna’ aimed at every household in the country to have at least one bank account. Explain how deposits made under the plan are going to affect national income of the country. [4]
Answer:
With the ‘Jan Dhan Yojna’ a greater number of individuals are brought under the ambit of banking system. Those individuals who earlier did not have savings account now have access to banking facilities and have opened savings account with the commercial banks. In this way, the commercial banks are able to tap greater savings which in turn can be used to lend loans for investment purposes. Thus, the yojna indirectly helps in increasing the investment and production in the economy which in turn would help in improving the national income.
Question 25.
An economy is in equilibrium. Calculate national income from the following. [4]
Autonomous consumption = 100
Marginal propensity to save = 0.2
Investment expenditure = 200
Answer:
Given
Autonomous consumption \((\overline{\mathrm{C}})\) = 100
MPS(s) = 0.2
i.e. MPC (c) = 1 – MPS = 1 – 0.2 = 0.8
1 = 200
y = ??
We know that at equilibrium,
Y = C + I
i.e. Y = \((\overline{\mathrm{C}})\) + cY + I
⇒ Y = 100 + 0.8Y + 200
⇒ Y = 0.8Y +300
⇒ Y – 0.8Y = 300
⇒ 0.2Y = 300
so, Y = 1,500
Question 26.
Giving reason explain how should the following be treated in estimation of national income: [6]
(i) Expenditure by a firm on payment of fees to a chartered accountant
(ii) Payment of corporate tax by a firm
(iii) Purchase of refrigerator by a firm for own use
Answer:
(a) The services of chartered accountant hired by the firm should not be included in the estimation of national income. This is because it forms a part of the firm’s intermediate consumption.
(b) Payment of corporate tax is not included in the national income as it is a mere transfer payment from the firm to the government. It is a part of corporate profits which already form part of national income, therefore, it should not be separately included in national income (in addition to corporate profits).
(c) Purchase of refrigerator by a firm for own use will be included in the national income as it is regarded as final consufnption expenditure.
Question 27.
Explain the concept of Inflationary Gap. Explain the role of Repo Rate in reducing this gap. [6]
OR
Explain the concept of Deflationary Gap and the role of ‘Open Market Operations’ in reducing this gap.
Answer:
Due to the excess of aggregate demand, there exists a difference (or gap) between the actual level of aggregate demand and full employment level of demand. This difference is termed as inflationary gap. This gap measures the amount of surplus in the level of aggregate demand. Graphically, it is represented by the vertical distance between the actual level of aggregate demand (ADE) and the full employment level of output (ADF). In the figure, EY denotes the aggregate demand at the full employment level of output and FY denotes the actual aggregate demand. The vertical distance between these two represents inflationary gap. That is,
FY – EY = FE (Inflationary Gap)
Let us understand the situation of excess demand and concept of inflationary gap with the help of the following figure.
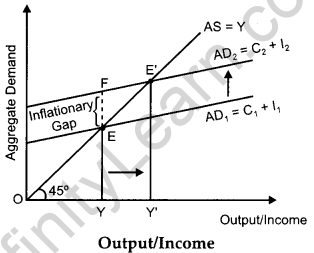
In the figure, AD1 and AS represents the aggregate demand curve and aggregate supply curve respectively. The economy is at full employment equilibrium at point ‘E’, where AD1 intersects AS curve. At this equilibrium point, OY represents full employment level and EY is aggregate demand at the full employment level of output.
Let us suppose that the actual aggregate demand for output is FY, which is higher than EY. This implies that actual aggregate output demanded by the economy FY is more than the potential (full employment) aggregate output EY. Thus, the economy is facing surplus demand. This situation is termed as excess demand. As a result of the excess demand, inflationary gap arises.
The inflationary gap is measured by the vertical distance between the actual aggregate demand for output and the potential (or full employment level) aggregate demand. In other words, the distance between FY and EY, i.e. FE represents the inflationary gap.
Repo rate refers to the rate at which the central bank lends to the commercial bank. In such inflationary gap, the central bank would increase repo rate. An increase in the repo rate increases the cost of borrowings for the commercial banks. This discourages the demand for loans and borrowings. Thereby, the consumption expenditure falls, and hence aggregate demand falls
OR
Due to the deficiency in the aggregate demand, there exists a difference (or gap) between the actual level of aggregate demand and full employment level of demand. This difference is termed as deflationary gap. This gap measures the amount of deficiency in the level of aggregate demand. Graphically, it is represented by the vertical distance between the aggregate demand at the full employment level of output (ADE) and the actual level of aggregate demand (ADf). In the figure below, EY denotes the aggregate demand at full employment level of output and CY denotes the actual aggregate demand. The vertical distance between these two represents deflationary gap. That is,
EY – CY = EC (Deflationary Gap)
Let us understand the situation of deficit demand and concept of deflationary gap with the help of the following figure.
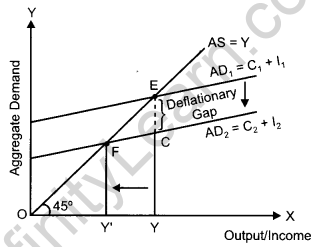
In the figure, AD1 and AS represents the aggregate demand curve and aggregate supply curve. The economy is at full employment equilibrium at point ‘E’, where AD1 intersects AS curve. At this equilibrium point, OY represents the full employment level of output and EY is the aggregate demand at the full employment level of output.
Let us suppose that the actual aggregate demand for output is only CY, which is lower than EY. This implies that actual aggregate output demanded by the economy CY falls short of the potential (full employment) aggregate output EY. Thus, the economy is facing a deficiency in demand. This situation is termed as deficit demand. As a result of the deficit demand, deflationary gap arises. The deflationary gap is measured by the vertical distance between the potential (or full employment level) aggregate demand and the actual aggregate demand for output. In other words, the distance between EY and CY, i.e. EC represents the deflationary gap.
To correct deflationary gap, the central bank purchases the securities in the market, thereby, increasing the flow of money and subsequently enhancing the purchasing power of the people. The higher purchasing power increases the aggregate demand.
Question 28.
Explain the role the government can play through the budget in influencing allocation of resources. [6]
Answer:
The government through its budgetary policy can reallocate the resources to different areas. In a mixed economy, the private producers aim towards profit maximisation, while, the government aims towards welfare maximisation. The private sector always tend to divert resources towards areas of high profit, while, ignoring areas of social welfare. In such a situation, the government through its budgetary policy reallocates resources to maintain a balance between the social objectives of welfare maximisation and economic objective of profit maximisation. For example- government levies taxes on socially harmful goods such as tobacco, etc., and provides subsidies for the socially desirable goods such as food grains, kerosene, etc.
Question 29.
Calculate National Income and (Personal Disposable Income ). [6]
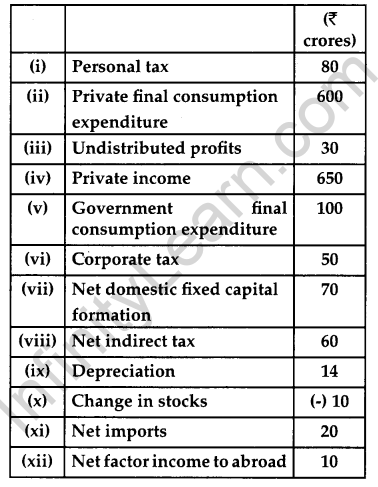
Answer:
National Income = Private final consumption expenditure + Government final consumption expenditure + (Net domestic fixed capital formation + depreciation + change in stock) – net imports – depreciation – Net Indirect Taxes – Net factor income to abroad
National income :
= 600 + 100 + (70 + 14 -10) – 20 -14 – 60 – 10 = ₹ 670
or, National income = ₹ 670 crore


CBSE Previous Year Question Papers Class 12 Economics 2015 Delhi Set – II
Note : Except for the following questions, all the remaining questions have been asked in previous set.
Section – A
Question 2.
Give equation of Budget Set. [1]
Answer:
The budget set or the consumption bundles available to the consumer will be governed by the following inequality condition :
P1x1 + P2x2 ≤ M
(Budget Constraint) where,
x1 = Quantity of good 1
x2 = Quantity of good 2
P1 = Price of good 1
P2 = Price of good 2
Question 5.
Giving reason comment on the shape of Production Possibilities curve based on the following schedule: [3]
| Good X (units) | Good Y (units) |
| 0 | 8 |
| 1 | 6 |
| 2 | 4 |
| 3 | 2 |
| 4 | 0 |
Answer:
Based on the below schedule, we can say that PPC is a downward sloping straight line. This is because the opportunity cost of producing one good (i.e. Good X) in terms of another (i.e. Good Y) remains the same, that is, 2 (ignoring the minus sign).
| Good X (Units) | Good Y (units) | Opportunity Cost |
| 0 | 8 | – |
| 1 | 6 | 2 |
| 2 | 4 | 2 |
| 3 | 2 | 2 |
| 4 | 0 | 2 |
The following figure depicts the shape of PPC.
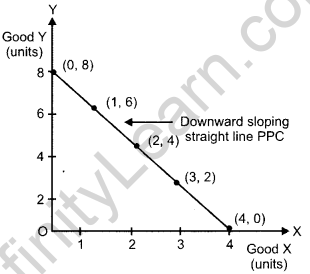
Thus, the shape of PPC is downward sloping straight line which can be attributed to the constant opportunity cost.
Question 10.
A consumer spends ₹ 60 on a good priced at ₹ 5 per unit. When price falls by 20 percent, the consumer continues to spend ₹ 60 on the good. Calculate price elasticity of demand by percentage method.
Answer:
Given:
Initial Total Expenditure (TE0) = ₹ 60
Final Total Expenditure (TE1) = ₹ 60
Initial Price (P0) = ₹ 5
Percentage change in price = – ₹ 20
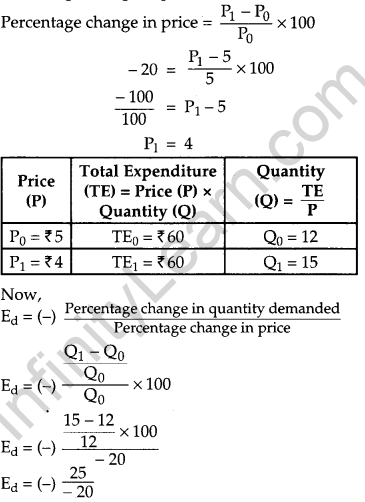
Ed = 1.25
∴ Ed = 1.25
Thus, the price elasticity of demand is 1.25.
Question 11.
Market for a good is in equilibrium. The demand for the good ‘decreases’. Explain the chain of effects of this change. [6]
Answer:
If market demand decreases, then the market demand curve shifts parallel leftwards to D2D2. NOW, at the initial price OP1, there exists excess supply equivalent to Oq1 – Oq’1 units of output. Due to the excess supply, the competition among the producers increases and they try to get rid of the excess stock by selling their output at comparatively lower price. The price will continue to fall until it reaches OP2, and the new equilibrium is established at point E2, where the new demand curve D2D2 intersects the initial market supply curve S1S1. Hence, a decrease in market demand with supply remaining constant, results in fall in the equilibrium price as well as the equilibrium quantity.
Decrease in demand ⇒ Excess supply at the existing price ⇒ Competition among the producers ⇒ Fall in the price level ⇒ New equilibrium ⇒ Fall in both quantity demanded as well as price.
Section – B
Question 21.
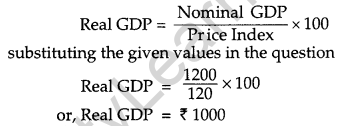
If the Nominal GDP is ₹ 1,200 and Price Index (with base = 100) is 120, calculate Real GDP.[3]
Answer:
Question 23.
An economy is in equilibrium. Find ‘autonomous consumption’ from the following: [4]
National income = 1,000
Marginal propensity to consume = 0.8
Investment expenditure = 100
Answer:
Given
Y = 1,000
MPC (c) = 0.8
I = 100
Autonomous consumption (\(\overline{\mathrm{C}}\)) = ??
We know that at equilibrium,
Y = C + I
i.e., 1,000 = \(\overline{\mathrm{C}}\) + cY + I
1,000 = \(\overline{\mathrm{C}}\) + 0.8 × 1,000 + 100
1,000 = \(\overline{\mathrm{C}}\) + 900
1,000 – 900 = \(\overline{\mathrm{C}}\)
So, \(\overline{\mathrm{C}}\) = 100
Question 29.
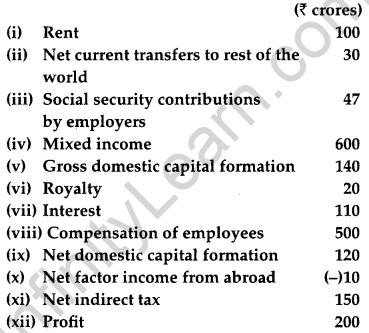
Calculate ‘Gross National Product at Market Price’ and ‘Net National Disposable Income’** : [6]
Answer:
GNPMP = Compensation of employees + Rent + Interest + Royalty + Profit + Mixed income + NFIA + Net indirect taxes + Gross domestic capital formation – Net domestic capital formation
GNPMP = 500 + 100 + 110 + 20 + 200 + 600 – 10 + 150 + 140 – 120
GNPMP = ₹ 1690 crore
CBSE Previous Year Question Papers Class 12 Economics 2015 Delhi Set – III
Note : Except for the following questions, all the remaining questions have been asked in previous set.
Section – A
Question 3.
Define Budget Set. [1]
Answer:
A budget set represents those combinations of consumption bundles that are available to the consumer given his/her income level and at the existing market prices. In other words, it represents those consumption bundles that the consumer can purchase using his/her money income (M).
Question 5.
Explain the feature ‘interdependence of firms’ in an oligopoly market. [3]
Answer:
There exists a very high degree of mutual interdependence between the firms in an oligopoly market. The price and the quantity decisions of a particular firm are dependent on the price and the quantity decisions of the rival (other) firms. Hence, a firm must take into consideration the probable rival reactions, while formulating its own price and output decisions.
Question 8.
Giving reason comment on the shape of Production Possibilities curve based on the following schedule: [3]
| Good X (units) | Good Y (units) |
| 0 | 20 |
| 1 | 18 |
| 2 | 14 |
| 3 | 8 |
| 4 | 0 |
Answer:
Based on the below schedule, we can say that PPC is concave to origin. This is because as the production increases, to produce each additional unit of Good X, more and more units of Good Y are sacrificed. In other words, the opportunity cost of producing one good in terms of another increases.
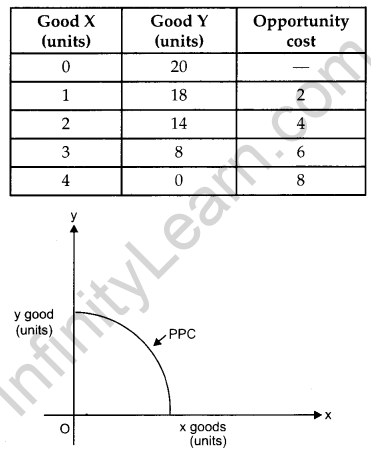
The following figure depicts the shape of PPC. Thus, the shape of PPC is concave which can be attributed to the law of increasing opportunity cost.
Question 9.
A consumer spends ₹ 100 on a good priced at ₹ 4 per unit. When price falls by 50 percent, the consumer continues to spend ₹ 100 on the good. Calculate price elasticity of demand by percentage method. [4]
Answer:
Given:
Initial Total Expenditure (TE0) = ₹ 100
Final Total Expenditure (TE1) = ₹ 100
Initial Price (P0) = ₹ 4
Percentage change in price = -50
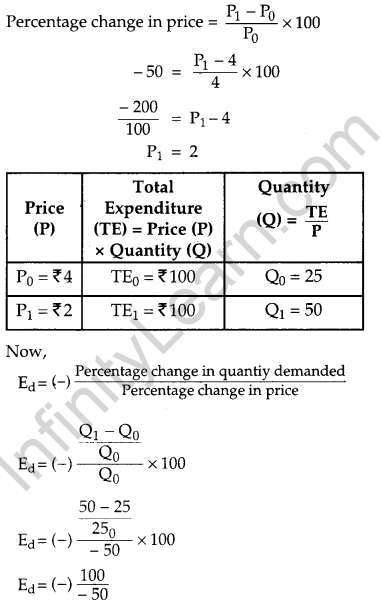
Ed = 2
∴ Ed = 2
Thus, the price elasticity of demand is 2.
Section – B
Question 22.
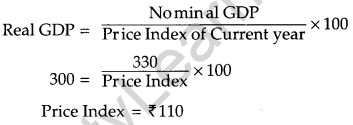
If the Real GDP is ₹ 300 and Nominal GDP is ₹ 330, calculate Price Index (base = 100). [3]
Answer:
We know,
Question 24.
An economy is in equilibrium. Find Marginal Propensity to Consume from the following : [4]
National income = 2,000
Autonomous consumption = 400
Investment expenditure = 200
Answer:
C = \(\overline{\mathrm{C}}\) + cY where,
\(\overline{\mathrm{C}}\) represents autonomous consumption expenditure
c represents marginal propensity to consumre
So,
Y = C + cY + I
Substituting the given values,
2000 = 400 + c (2000) + 200
2000 = 600 + 2000 c
or, c = 0.7
Thus, marginal propensity to consume is 0.7.
Question 29.
Calculate ‘Net Domestic Product at Factor Cost’ and ‘Gross National Disposable Income’** : [6]
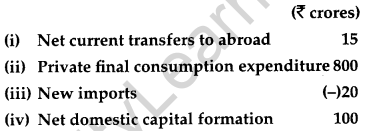
Answer:
NDPFC = Private final consumption expenditure + Government final consumption expenditure + (Net domestic capital formation + depreciation) – Net imports – depreciation – Net indirect taxes
or, NDPFC = 800 + 200 + 100 + 50 – (-20) -50 -120
or, NDPFC = ₹ 1000 crore
