
Statistics for Economics Class 11 Notes Chapter 6 Measures of Dispersion
Dispersion
“It is the measure of the variation of the item”. According to Spiegel, ‘The degree to which numerical data tend to spread about an average value is called the variation or dispersion of the data”.
Different methods of measuring dispersion are
- Range
- Quartile deviation
- Mean deviation
- Standard deviation
Range Range is the difference between the highest value and the lowest value in a series.
R = H – L or L – S
H or L = Highest or Largest value of series
L or S = Lowest or Smallest value of series
Coefficient of range = \(\frac{H-L}{H+L} \text { or } \frac{L-S}{L+S}\)
Calculation of Range and Coefficient of Range
(i) Individual Series and Discrete Series
Range = H – L or L – S
Coefficient of Range = \(\frac{H-L}{H+L} \text { or } \frac{L-S}{L+S}\)
(ii) Frequency Distribution Series
- Mid values of the class interval are found, difference between the highest and lowest values would be the range.
- According to this method, we find the difference between lower limit of the first class interval and upper limit of the last class interval in the series would be the range.
(iii) Inter Quartile Range
Difference between third quartile ( Q3) and first quartile of a series, is called Inter quartile range.
IQR = Q3 – Q1
Quartile Deviation
Quartile deviation is half of inter quartile range.
QD = \(\frac{Q_{3}-Q_{1}}{2}\)
It is also called semi-inter quartile range.
(i) Coefficient of Quartile Deviation (Coefficient of QD)
Coefficient of QD = \(\frac{Q_{3}-Q_{1}}{Q_{3}+Q_{1}}\)
(ii) Calculation of Quartile Deviation
(a) Individual Series and Discrete Series First find out Q1 and Q3 from the following equations
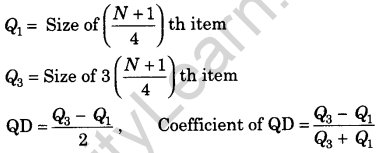
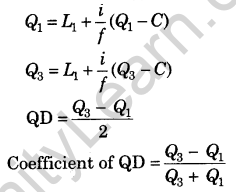
(b) Frequency Distribution

Mean Deviation
“Mean deviation is the arithmetic average of deviation of all the values taken from a statistical average of series. In taking deviation of values, algebraic signs + and – are not taken into consideration, that is negative deviations are also treated as positive deviations”.
(i) Formulas for Mean Deviation
(a) If deviations are taken from median, the following formula is used
(b) If deviation are taken from arithmetic mean of the series
![]()
(ii) Coefficient of Mean Deviation
- Coefficient of mean deviation from Mean = \(\frac { { MD }_{ \overline { X } } }{ \overline { X } } \)
- Coefficient of MD from Median = \(\frac{M D_{M}}{M}\)
- Coefficient of MD from Mode = \(\frac{M D_{Z}}{Z}\)
(iii) Calculation of Mean Deviation or Coefficient of Mean Deviation
(a) Individual Series
Estimating MD through Median, MD = \(\frac{\Sigma|d M|}{N}\)
Estimating MD through Mean, MD = \(\frac{\Sigma|d \overline{X}|}{N}\)
Estimating Coefficient of MD through Median Coefficient of MD = \(\frac{M D_{M}}{M}\)
Estimating Coefficient of MD through Mean Coefficient of MD = \(\frac { { MD }_{ \overline { X } } }{ \overline { X } } \)
(b) Discrete Series
Estimating MD through median, MDM = \(\frac{\Sigma f|d m|}{N}\)
Estimating MD through mean, \(M D_{\overline{X}}\) = \(\frac{\Sigma f|d \overline{X}|}{N}\)
Estimating Coefficient of MD through Median Coefficient of MD = \(\frac{M D_{M}}{N}\)
Estimating Coefficient of MD through Median Coefficient of MD = \(\frac { { MD }_{ \overline { X } } }{ \overline { X } } \)
(c) Frequency Distribution Series
Mean deviation from Median, MDM = \(\frac{\Sigma f|d M|}{\Sigma f}\)
Coefficient of MD = \(\frac{M D_{M}}{M}\)
Mean deviation from Mean, \(M D_{\overline{X}}\) = \(\frac{\Sigma f|d \overline{X}|}{\Sigma f}\)
Coefficient of MD = \(\frac{M D_{\overline{X}}}{\overline{X}}\)
Standard Deviation
Standard deviation is the square root of the arithmetic mean of the squares of deviations of the items from their mean values.
Coefficient of Standard Deviation
This is a relative measure of the dispersion of series.
Coefficient of standard deviation (Coefficient of σ) = \(\frac{\sigma}{\overline{X}}\)
(i) Calculation of Standard Deviation
(a) Direct Method
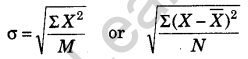
Here, σ = Standard Deviation;
ΣX2 = Sum total of the squares of deviation,
\(\overline{X}\) = Mean Value,
\(X-\overline{X}\) = Deviation from mean value;
N = number of items
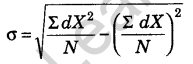
(b) Short-cut Method
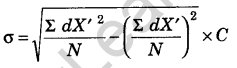
(c) Step Deviation Method
(ii) Calculation of Coefficient of Variation
(a) Individual series = \(\frac{\sigma}{X}\) × 100
(b) Discrete series = \(\frac{\sigma}{X}\) × 100
(c) Frequency distribution series = \(\frac{\sigma}{X}\) × 100
Lorenz Curve
It is a curve that shows deviation of actual distribution from the showing equal distribution.
(i) Construction of the Lorenz Curve
- Calculate class mid-points
- Calculate cumulative frequencies as in column 6
- Express the grand total of column 3 and 6 as 100 and convert the cumulative totals in these columns in to percentage.
- Now, on the graph paper, take the cumulative percentage of the variable on Y-axis and cumulative percentages of X-axis.
- Draw a line joining co-ordinate (0, 0) with (100,100) this is called the line of equal distribution.
- Plot the cumulative percentages of the variable with cumulative percentages of frequency.
