
Table of Contents
Table of Contents
- Distance–Time Graph definition
- Distance–Time Graph for Uniform Motion
- Distance–Time Graph for Uniform Motion Example
- Drawing a Graph of Uniform Motion
- Reading a Graph of Uniform Motion
- Summary
- Did You Know?
- What’s Next?
In our previous segment, we learned about Uniform and Non-uniform acceleration. In this segment we will learn about the Distance-Time Graphs of a body in uniform motion.
What is a Distance–Time Graph?
A distance-time graph is a 2-dimensional graph of distance versus time. In this graph, time is represented along the X-axis and distance is represented along the Y-axis.
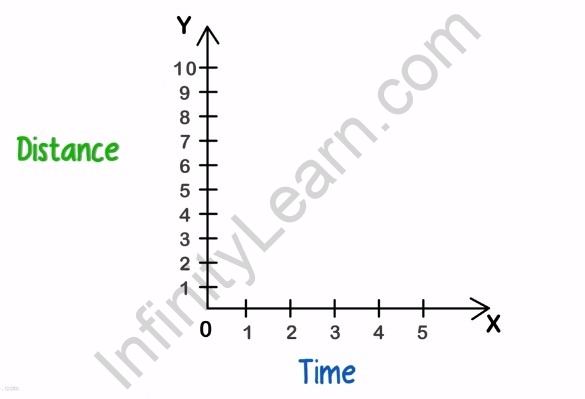
Distance–time graph
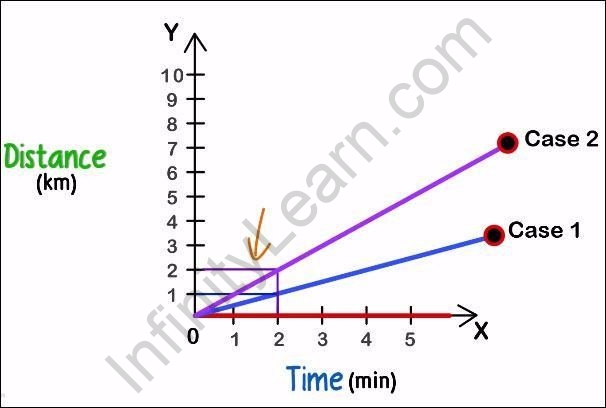
Distance–time graph for uniform motion
Distance-time graph can tell us about the uniform motion of a body in three ways:
- If the object is stationary, the distance covered in a particular interval of time is zero. Hence, the graph is a horizontal line along the X-axis.
- If the object moves slowly, it covers less distance in a given interval of time. Hence, the graph is slightly angled towards the X-axis.
- If the object moves fast, it covers more distance in a given interval of time. Hence, the graph is slightly angled towards the Y-axis.
Distance covered


Example of uniform motion
Drawing a graph of uniform motion
Consider that the X-axis has intervals of 1 minute, and the Y-axis has intervals of 1 km.
Suppose the distance travelled by a vehicle is 2 km each minute (????? = 2 ?? ).The graph will
???.
be a straight line which starts at the (0 km, 0 minute) point and passes through the (2 km, 1 minute) point.
Now as we extend this graph ahead, it will pass through all the points of distance versus time that the vehicle will cover at the actual uniform speed, that is 2 \frac{km}{min.}. Using this graph of uniform motion, we can find out the exact distance covered by that vehicle at a particular point of time. And conversely, find out the time taken to cover a particular value of distance.
