Revenue – CBSE Notes for Class 12 Micro Economics
Introductio
This chapter is numerically based and comprises of the concepts of revenue, total revenue, average revenue, marginal revenue and their relationships, both when price is constant and when price is falling.
1. Revenue of a firm refers to receipts from the sale of output in a given period.
2. (a) The total money receipt of a firm from the sale of given amount of output is known as Total Revenue.
Total Revenue = Price x Quantity
(b) For example,
(i) if a firm sells 100 chairs at a price of Rs. 200 per chair, the total revenue will be 100 Chairs x Rs. 200 = Rs. 20,000
(ii)

(c)(i)TR is summation of MR: Total Revenue can also be calculated as the sum of marginal revenues of all the units sold.
It means, TRn = MR1 + MR2 + MR3 +……….+ MRn
(ii)

3. (a) The per revenue received from the sale of given amount of output is knows as Average Revenue.
(b)As, sellers receive revenue according to price, price and AR are one and the same thing. This can be explained as under,

(c) For example,
(i) if total revenue from the sale of 100 chairs at a price of Rs. 200 per chair is Rs. 20,000,
average revenue will be = Rs. 200
(ii)

(d) A buyer’s demand curve graphically represents the quantities demanded by a buyer at various prices. In other words, it shows the various levels of average revenue at which different quantities of the goods are sold by the seller. Therefore, in economics, it is customary to refer AR curve as the Demand Curve of a firm.
4. (a) Marginal revenue is the additional revenue when an additional unit of output is sold.

(ii) (a) We know that MR is the change in TR when one more unit is sold. However, when change in units sold is more than one, then MR can also be calculated as Change in Total Revenue ATR
Change in number of units AQ
(b) For example: If the total revenue realised from sale of 100 chairs is Rs. 20,000 and that from sale of 110 chairs is Rs. 30,000, the marginal revenue will be,
(ii)

Relationship Between Revenue Curves
Case I: Relationship between Average Revenue and Marginal Revenue when Price is Constant
1. When price remains the same at all output levels, the firm cannot influence the prevailing market price of the commodity. The price is given to it.
2. It can sell any amount of the commodity at this given price. Under such a case firm’s average and marginal revenue remains equal and their curves coincide as shown in given schedule and diagram:

3. It can be seen from the above schedule and diagram that price remains same and equal to MR at all levels of output. As the result of, demand curve (or AR curve) is perfectly elastic.
4. When a firm is able to sell more output at the same price, then AR = MR at all levels of output.
Case II: Relationship between Total Revenue and Marginal Revenue when Price is Constant
1. When price of the commodity is constant, then firms can sell any quantity of output
at a given price.
2. So, MR curve (and AR curve) is a horizontal straight line parallel to the X-axis. Since MR remains constant, TR also increases at a constant rate (see Schedule).

3. Due to this reason, the TR curve is a positively sloped straight line (see Figure). As TR is zero at zero level of output, the TR curve starts from the origin.
Case III: Relationship between Average Revenue and Marginal Revenue when Price Falls
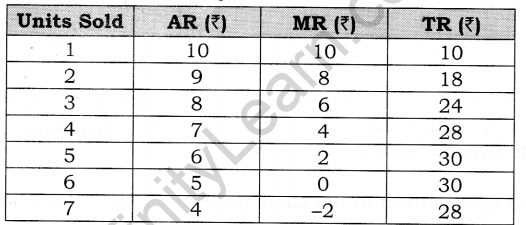
1. When price falls, with rise in output, then AR falls, MR also falls but at a much faster rate. As a result, the revenue from every additional unit (i.e. MR) will be less than AR.
2. As a result, both AR and MR curves slope downwards from left to right. This can be explained with the help of given Schedule and Figure:

3. In the above schedule, both MR and AR fall with increase in output. However, the fall in MR is double than that in AR, i.e., MR falls at a rate which is twice the rate of fall in AR. As a result, MR curve is steeper than the AR curve. When the AR curve is extended till point B, then MR curve cuts the X-axis exactly halfway between the point of origin (O) and point B, so that OA = AB.
Case IV: Relationship between Total Revenue and Marginal Revenue when Price Falls
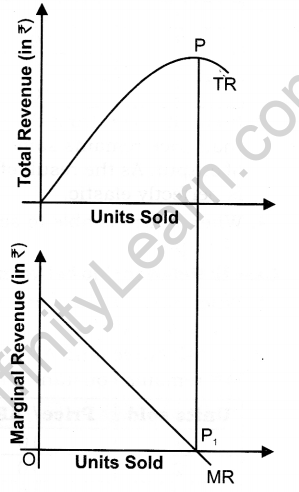
1. When MR falls and remains positive, than total revenue increase at a diminishing rate.
(a) As per Schedule, till the 5th unit of output, MR falls but remains positive and, thus, TR increases at diminishing rate.
(b) In Figure, the TR curve increases at a diminishing rate (till point P) as long as MR is positive (till point P1).


2. When MR is zero, then TR is maximum and constant.
(i) As per Schedule, at the 6th unit, MR is zero and TR is at its maximum and constant.
(ii) In Figure, when MR is zero (point P1), Total Revenue reaches its highest point (point P).
3. When MR is negative, then TR falls.
(i) As per Schedule, after 6th unit, MR not only falls, but also becomes negative due to which TR starts declining.
(ii) In Figure when MR becomes negative (after point P1), then Total Revenue Falls (after point P).
Words that Matter
1. Revenue: Revenue of a firm refers to receipts from the sale of output in a given period.
2. Total Revenue: The total money receipt of a firm from the sale of given amount of output is known as total Revenue.
3. Average Revenue: The per unit revenue received from the sale of given amount of output is known as Average Revenue.
4. Marginal Revenue: Marginal revenue is the additional revenue when an additional unit of output is sold.

