Banner 0
Banner 1
Banner 2
Banner 3
Banner 4
Banner 5
Banner 6

Q.

A study was conducted to find out the concentration of sulphur dioxide in the air in parts per million (ppm) of a certain city. The data obtained for 30 days is as follows: 

A study was conducted to find out the concentration of sulphur dioxide in  the air - CBSE Class 9 Maths - Learn CBSE Forum

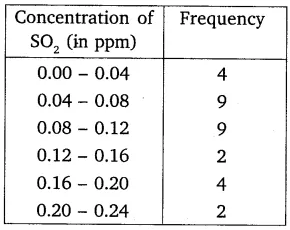
 (i) Make a grouped frequency distribution table for this data with class intervals as 0.00 - 0.04, 0.04 - 0.08, and so on. 

(ii) For how many days, was the concentration of sulphur dioxide more than 0.11 parts per million?


see full answer

Talk to JEE/NEET 2025 Toppers - Learn What Actually Works!

Real Strategies. Real People. Real Success Stories - Just 1 call away
An Intiative by Sri Chaitanya

(Unlock A.I Detailed Solution for FREE)

Ready to Test Your Skills?

Check your Performance Today with our Free Mock Test used by Toppers!

Take Free Test

Detailed Solution

(i) We draw the table of grouped frequency distribution with the class size as 0.04 for each class as follows,

To find out the concentration of SO2 in the air (in parts per million, i.e.  ppm), - CBSE Class 10 Maths - Learn CBSE Forum

so the total 30 days data is used to make the frequency distribution table 

(ii) For the  days having  the concentration of sulphur dioxide more than 0.11 parts per million: 

if we observe the above table then it is seen that, 

The concentration is more than 0.11 for 8 days 

Watch 3-min video & get full concept clarity

Best Courses for You

JEE

JEE

NEET

NEET

Foundation JEE

Foundation JEE

Foundation NEET

Foundation NEET

CBSE

CBSE

score_test_img

Get Expert Academic Guidance – Connect with a Counselor Today!

whats app icon