Banner 0
Banner 1
Banner 2
Banner 3
Banner 4
Banner 5
Banner 6

Q.

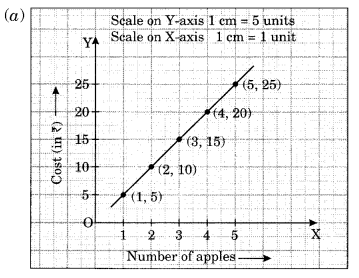
Draw the graphs for the following tables of values, with suitable scales on the axes.

(a) Cost of apples

NCERT Solutions for Class 8 Maths Chapter 15 Introduction to Graphs Ex 15.3 Q1

(b) Distance travelled by a car

NCERT Solutions for Class 8 Maths Chapter 15 Introduction to Graphs Ex 15.3 Q1.1

(i) How much distance did the car cover during the period 7:30 am to 8 am?
(ii) What was the time when the car had covered a distance of 100 km since its start?


(c) Interest on deposits for a year.

NCERT Solutions for Class 8 Maths Chapter 15 Introduction to Graphs Ex 15.3 Q1.2

(i) Does the graph pass through the origin?
(ii) Use the graph to find the interest on 2500 for a year.
(iii) To get an interest of 280 per year, how much money should be deposited?

see full answer

Talk to JEE/NEET 2025 Toppers - Learn What Actually Works!

Real Strategies. Real People. Real Success Stories - Just 1 call away
An Intiative by Sri Chaitanya

(Unlock A.I Detailed Solution for FREE)

Ready to Test Your Skills?

Check your Performance Today with our Free Mock Test used by Toppers!

Take Free Test

Detailed Solution

NCERT Solutions for Class 8 Maths Chapter 15 Introduction to Graphs Ex 15.3 Q1.3
Watch 3-min video & get full concept clarity

Best Courses for You

JEE

JEE

NEET

NEET

Foundation JEE

Foundation JEE

Foundation NEET

Foundation NEET

CBSE

CBSE

score_test_img

Get Expert Academic Guidance – Connect with a Counselor Today!

whats app icon