
Table of Contents
Probability and statistics are branches of mathematics concerned with the laws governing random events, as well as the collection, analysis, interpretation, and presentation of numerical data. Probability originated in the 17th century with the study of gambling and insurance, and it is now an indispensable tool in both social and natural sciences. Statistics can be traced back thousands of years to census counts; however, as a distinct scientific discipline, it was developed in the early nineteenth century as the study of populations, economies, and moral actions, and later in that century as a mathematical tool for analysing such numbers.
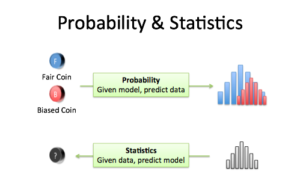
Probability refers to the possibility of any random event’s outcome. This term is defined as determining the likelihood of an event occurring.
What are the chances of getting ahead when we flip a coin in the air, for example? The number of possible outcomes determines the answer to this question. In this case, the outcome could be either head or tail. As a result, the probability of a head appearing, as a result, is 1/2. The probability is a measure of the likelihood that an event will occur. It assesses the event’s certainty. The probability formula is as follows:
P(E) = Number of Favourable Outcomes/Number of total outcomes
P(E) = n(E)/n(S)
Statistics is the study of data collection, analysis, interpretation, presentation, and organisation. It is a method of gathering and summarising data. This has a wide range of applications, from small to large. Stats are used for all data analysis, whether it is the study of the country’s population or its economy. Statistics has a wide range of applications in many fields, including sociology, psychology, geology, weather forecasting, and so on. The information gathered for analysis here could be quantitative or qualitative. Quantitative data is further classified into two types: discrete and continuous. Continuous data has a range rather than a fixed value, whereas discrete data has a fixed value. This concept employs a plethora of terms and formulas.
Probability and Statistics Terminology
Various terms are used in probability and statistics concepts, such as:
- Random Experiment
- Sample Sample
- Random variables
- Expected Value
- Independence
- Variance
- Mean
Experiment at Random
A random experiment is one in which the outcome cannot be predicted until it is observed. For example, when we throw dice at random, the outcome is unknown to us. We are able to obtain any number between 1 and 6. As a result, the outcome of this experiment is completely arbitrary.


Sample Space
A sample space is the collection of all possible outcomes or results of a random experiment. Assume we threw dice at random, and the sample space for this experiment includes all possible outcomes of throwing a dice, such as;
Sample Space { 1,2,3,4,5,6}
Random Variables
Random variables are variables that represent the possible outcomes of a random experiment. They are classified into two types:
Variables with Discrete Randomness
Variables with Continuous Randomness
Discrete random variables accept only distinct values that can be counted. Continuous random variables, on the other hand, have an infinite number of possible values.
Independent Event
When the probability of one event has no effect on the probability of another, the events are said to be independent of one another. For example, if you flip a coin and roll a dice at the same time, the probability of getting a ‘head’ is independent of the probability of rolling a 6.


FAQs
What is statistics and probability, and what are some examples?
It is concerned with the possibility (probability) of an event occurring. For instance, if you toss a fair coin four times, the results may not be two heads and two tails. If you toss the same coin 4,000 times, the results will be roughly half heads and half tails.
Is statistics and probability difficult?
Probability and statistics are difficult, not in some obscure objective sense (arithmetic geometry is harder by most measures), but difficult in relation to their pervasiveness and how they are perceived.
