Table of Contents
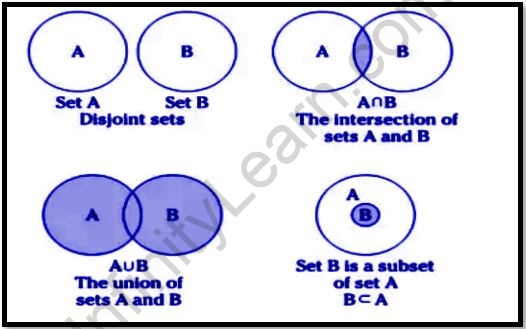
Venn diagrams are diagrams that are used to visually describe sets, relationships between sets, and operations are done on them. The Venn diagram, created by John Venn, represents the relationship between sets using circles (overlapping, intersecting, and non-intersecting).
A brief outline
A Venn diagram, also known as a set diagram or a logic diagram, depicts several set operations such as set intersection, set union, and set difference. It’s also used to represent a set’s subsets. Natural numbers, for example, are a subset of whole numbers, which are a subset of integers.
Important concepts
To depict all possible relationships between various sets, a diagram is utilized. Any closed figure, such as a Circle or a Polygon, can be used to represent a Venn diagram (square, hexagon, etc.). In most cases, though, we use circles to depict each set.
We may observe a Venn diagram around the universal set, which has two independent sets, X and Y, which are represented by a rectangle shape. As a result, the sets X and Y are disjoint. In a circular shape, the two sets, X and Y, are depicted. Sets X and Y have no link to one another in this diagram, although they are both members of a universal set.
For example, set X = {Set of even numbers} and set Y = {Set of odd numbers} and Universal set, U = {set of natural numbers}
Venn Diagram Symbols
The symbols used while representing the operations of sets are:
Union of sets symbol: ∪
The intersection of sets symbol: ∩
Complement of set: A’ or Ac
Set operations Venn Diagrams
Many operations on sets are performed in set theory, including:
- Union of set
- Set’s intersection
- Set’s complement
- Set difference

Significance of Venn diagram in set theory in IIT JEE exam
The Venn diagram and related set theory are addressed in the Venn diagram chapter, which contributes to around 4% of the total 120 marks on the JEE exam. On this topic, two to three questions worth a total of eight points will be asked.
FAQs
What exactly is a Venn diagram?
A Venn diagram is a diagram that depicts all conceivable relationships between two sets of data.
What are Venn diagrams and how do they work?
A Venn diagram is a graphic that employs circles to depict relationships between objects or finite groups of objects. Circles that overlap share certain characteristics, but circles that do not overlap do not. As a result, Venn diagrams assist in visually describing the similarities and contrasts between the supplied concepts.
In arithmetic, how do you do Venn diagrams?
Venn diagrams are used in mathematics to depict the relationship between two or more sets. This method of presenting sets or specific scenarios aids in a better understanding of the scenario and allows it to be concluded quickly.


