Table of Contents
Table of Contents
- Velocity–Time Graph
- Representing Constant Velocity on a Velocity–Time Graph
- Displacement of a Body Moving at a Constant Velocity
- Summary
- Did You Know?
- What’s Next?
In the previous segment, we learnt about distance–time graphs for uniform and non- uniform motion. In this segment, we will learn about the velocity–time graph for constant velocity.
What is a Velocity–Time graph?
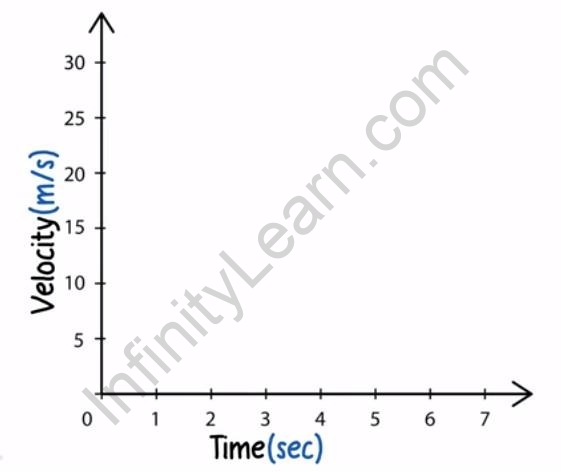
A Velocity–time graph is a 2-dimensional graph of velocity versus time. In this graph, time is represented along the X-axis and velocity is represented along the Y-axis.

Velocity–Time Graph
How to represent constant velocity on a velocity-time graph?
We know that a body moving with constant velocity moves with the same velocity in equal intervals of time.
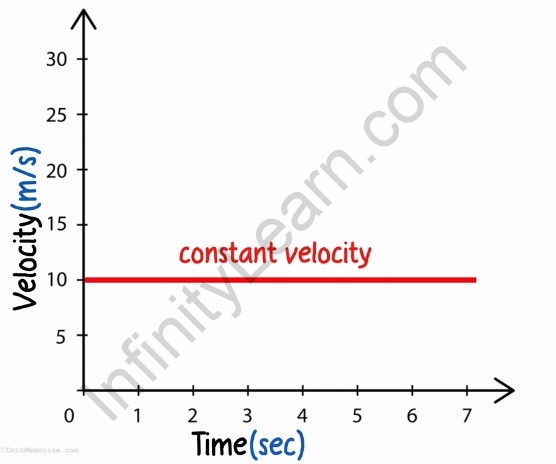
This means that the graph of constant velocity of such a body is nothing but a straight line parallel to the X-axis or the time-axis.

A constant velocity graph of body moving at ?? ?
?
How to find the displacement of a body moving at a constant velocity?
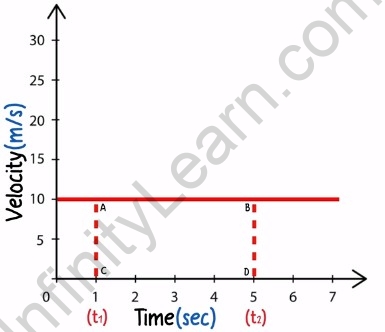
We know that displacement is the product of velocity and time. On a velocity-time graph, we find the displacement of a body by measuring the area between the velocity-time graph and the time axis.

Example of velocity-time graph
Consider, a vehicle is travelling at a constant velocity of at 10 ?, parallel to the X-axis.
?
10 ?.
?
The graph is a straight line drawn
Now, we wish to find the displacement of the body at 4 seconds.


