
Table of Contents
Important Graphs in Biology for NEET 2025: In preparation for NEET 2025, understanding graphs in biology is essential for mastering important concepts. These graphs simplify complex processes, providing clear visual insights into biological phenomena. From enzyme kinetics to population dynamics, these graphical representations help students analyze data and predict outcomes, making them a fundamental part of exam preparation. Whether it’s tracking enzyme activity or understanding growth patterns in ecosystems, a solid grasp of these graphs is crucial for success in biology sections of competitive exams like NEET.
Importance of Understanding Graphs in Biology for NEET Exam


- Simplifies Complex Biological Data: Graphs allow students to interpret complex biological processes like enzyme kinetics and population dynamics, which are essential for NEET. They provide a clear visual representation that aids in understanding how variables change over time or under specific conditions.
- Enhances Problem-Solving Skills: NEET Biology Syllabus often includes graph-based questions that test students’ ability to analyze and interpret data. Mastery of graphs helps students solve these problems efficiently by extracting key information quickly.
- Boosts Retention of Concepts: Visual learning through graphs enhances memory retention of important topics like genetics, ecology, and physiology. Graphs like the oxygen dissociation curve or logistic growth curve help solidify difficult concepts, making them easier to recall during the exam.
- Clarifies Relationships Between Variables: Graphs illustrate the cause-and-effect relationships between biological factors. For example, a graph showing enzyme activity versus temperature helps explain how temperature affects metabolic reactions, which is crucial for answering NEET questions on metabolism.
- Helps Predict Trends: Graphs enable students to predict outcomes in biological systems. For instance, the population growth curve helps predict population changes over time, a concept tested in the ecology section of NEET.
- Improves Data Interpretation Skills: Being able to read and interpret graphs is a critical skill for NEET aspirants. Graphs in biology often depict real-world data, requiring students to draw accurate conclusions, a key component of success in NEET.
- Effective Revision Tool: Graphs offer a quick and efficient way to review key concepts during NEET preparation. They encapsulate large amounts of information in a simple format, allowing for easy revision of complex topics like respiration or gene frequency.
Also Check – How to Score 360 in NEET Biology 2025
Important Graphs in Biology for NEET 2025 – Class 11
Understanding biology through graphical representation is crucial for Class 11 students preparing for NEET 2025. These graphs help visualize key biological processes and phenomena, aiding in comprehension and retention. Below are some of the most important graphs for Class 11 that frequently appear in NEET.


1. Enzyme Activity vs. Temperature and pH
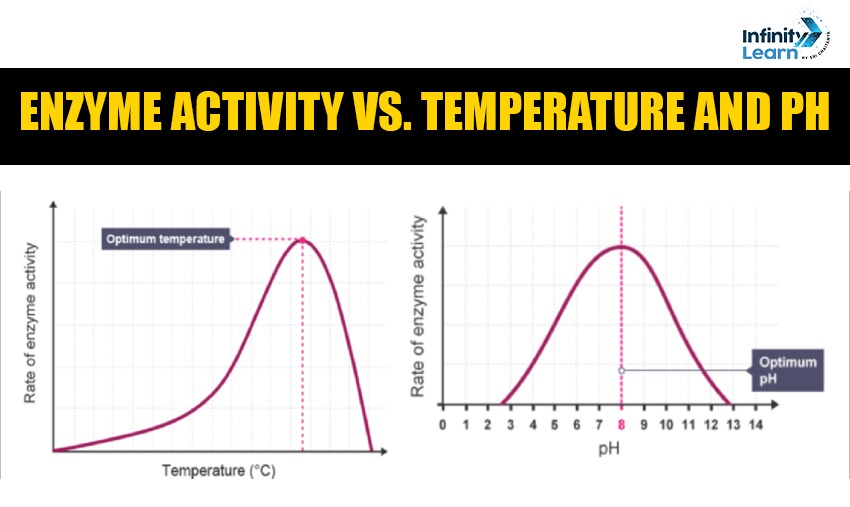
This graph is central to the topic of enzymes. It demonstrates how enzyme activity varies with temperature and pH. Initially, as temperature or pH increases, enzyme activity rises, reaching a peak at the optimum point. However, beyond this optimum temperature or pH, the enzyme denatures, leading to a sharp decline in its activity. This graph helps students understand the delicate balance in biological reactions, where enzymes are affected by environmental conditions.
2. Population Growth Curve (Sigmoid Curve)
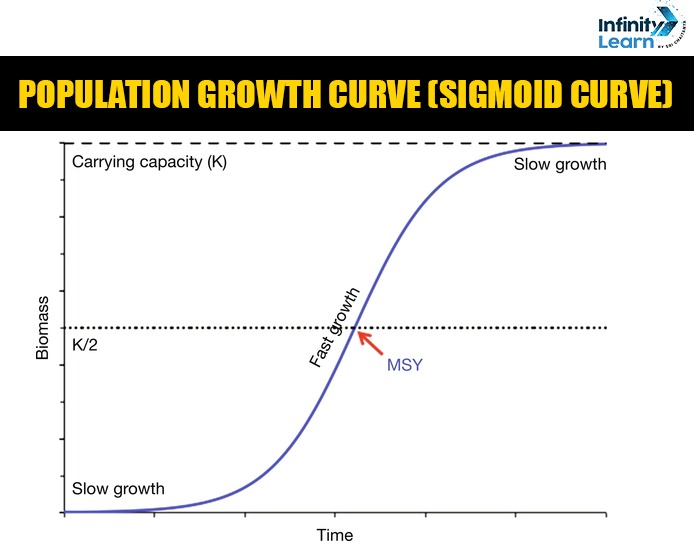
The sigmoid population growth curve is significant in the ecology section. It consists of four phases: lag phase (slow initial growth), exponential phase (rapid growth), stationary phase (growth rate slows as resources are limited), and death phase (population declines due to depletion of resources). This S-shaped curve helps explain how populations grow under natural conditions and the factors that regulate their size, which is essential for understanding ecosystems and population dynamics.
3. Stomatal Opening and Closing vs. Light Intensity
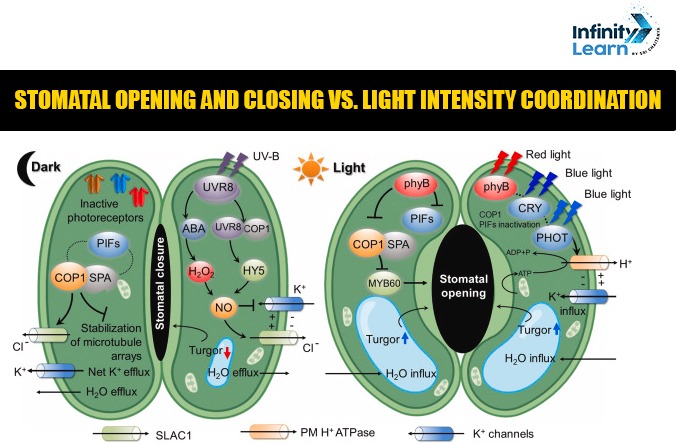
This graph shows the correlation between light intensity and stomatal movement in plants. Stomata, small openings on the surface of leaves, regulate gas exchange and water loss. The graph highlights how stomata open wider as light intensity increases, allowing for more gas exchange during photosynthesis. As light decreases, stomata close to conserve water. This concept is crucial for plant physiology and is often tested in NEET.


4. Osmotic Pressure vs. Solute Concentration

This diagram is important for understanding osmosis, a key process in cell biology. It shows that as solute concentration increases, osmotic pressure also rises. This relationship helps explain how water moves across cell membranes in living organisms, which is fundamental to processes like nutrient absorption and waste removal. A strong grasp of osmosis and its graphical representation is essential for NEET.
5. Action Potential Curve
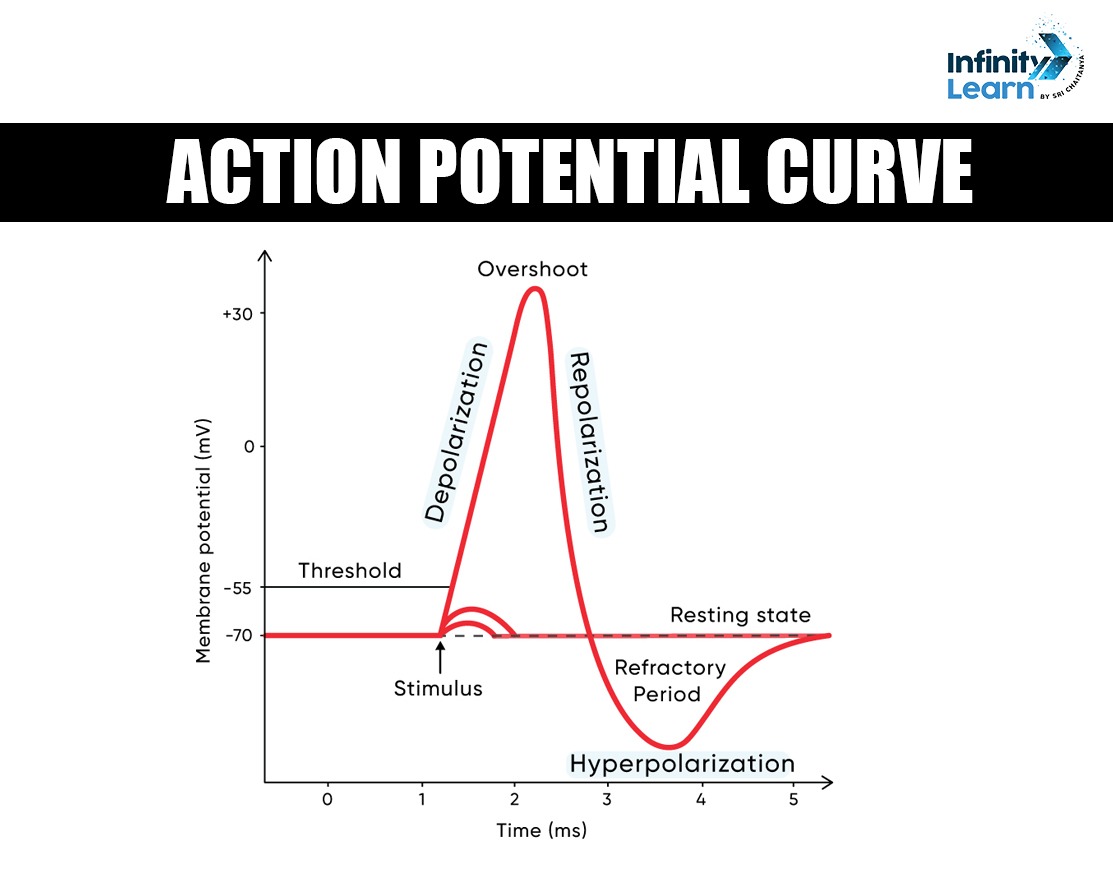
The action potential graph represents the electrical changes that occur in a neuron during the transmission of nerve impulses. It includes stages such as depolarization, repolarization, and the refractory period. This graph is critical in neurobiology and helps explain how signals travel through neurons. Understanding the action potential graph is crucial for the nervous system section of NEET.
Important Graphs in Biology for NEET 2025 for Class 12
For Class 12 students, NEET 2025 demands a deeper understanding of biology through key graphs that explain advanced concepts. Here are the essential graphs for Class 12 that are commonly tested in the NEET exam.
1. Michaelis-Menten Graph (Enzyme Kinetics)
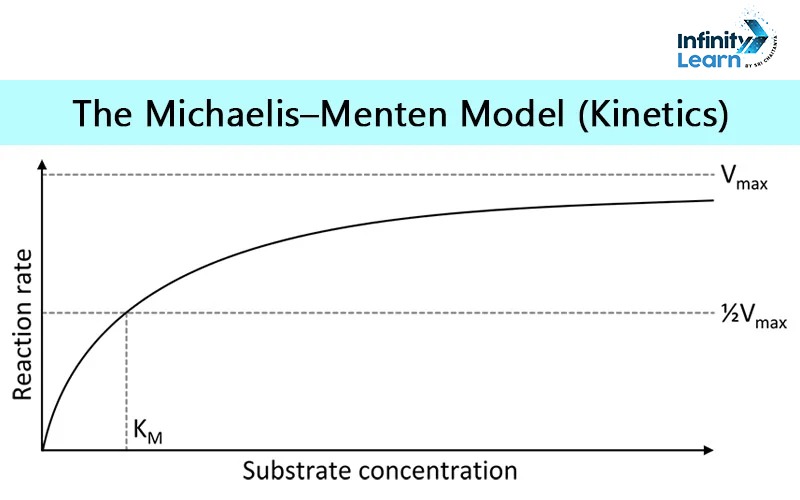
The Michaelis-Menten graph is central to the study of enzyme kinetics. It shows how the rate of an enzymatic reaction changes as substrate concentration increases. Initially, the reaction rate rises sharply but eventually plateaus, indicating that all active sites of the enzyme are occupied (enzyme saturation). This graph helps explain the efficiency of enzymes and the factors influencing reaction rates, which is a core concept in metabolism.
2. Hardy-Weinberg Equilibrium Graph
The Hardy-Weinberg graph is crucial in population genetics. It shows the stability of allele frequencies in a population over generations, provided certain conditions like random mating and no mutations are met. This graph helps illustrate the principle of genetic equilibrium and is vital for understanding evolution and population genetics, which are frequently covered in NEET.
3. Oxygen Dissociation Curve of Hemoglobin
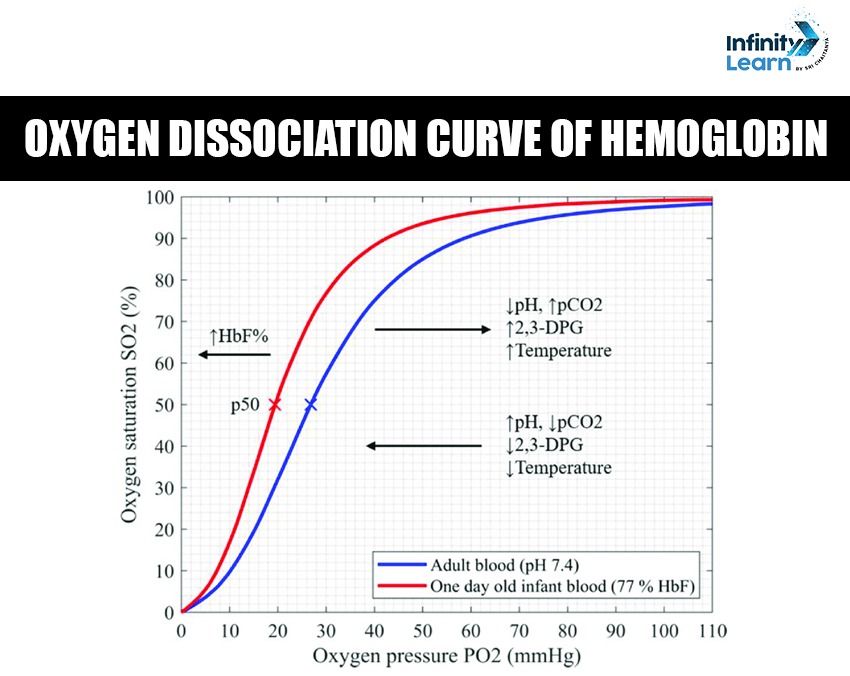
This graph is essential for understanding respiratory physiology. It shows the relationship between the partial pressure of oxygen (pO2) and hemoglobin saturation. At high pO2, hemoglobin is almost fully saturated with oxygen, whereas at low pO2, oxygen is released to the tissues. This sigmoidal curve helps explain oxygen transport in the blood and how it is influenced by factors like pH and CO2 concentration (Bohr effect). This is a key concept in human physiology, often appearing in NEET.
4. Logistic Growth Curve
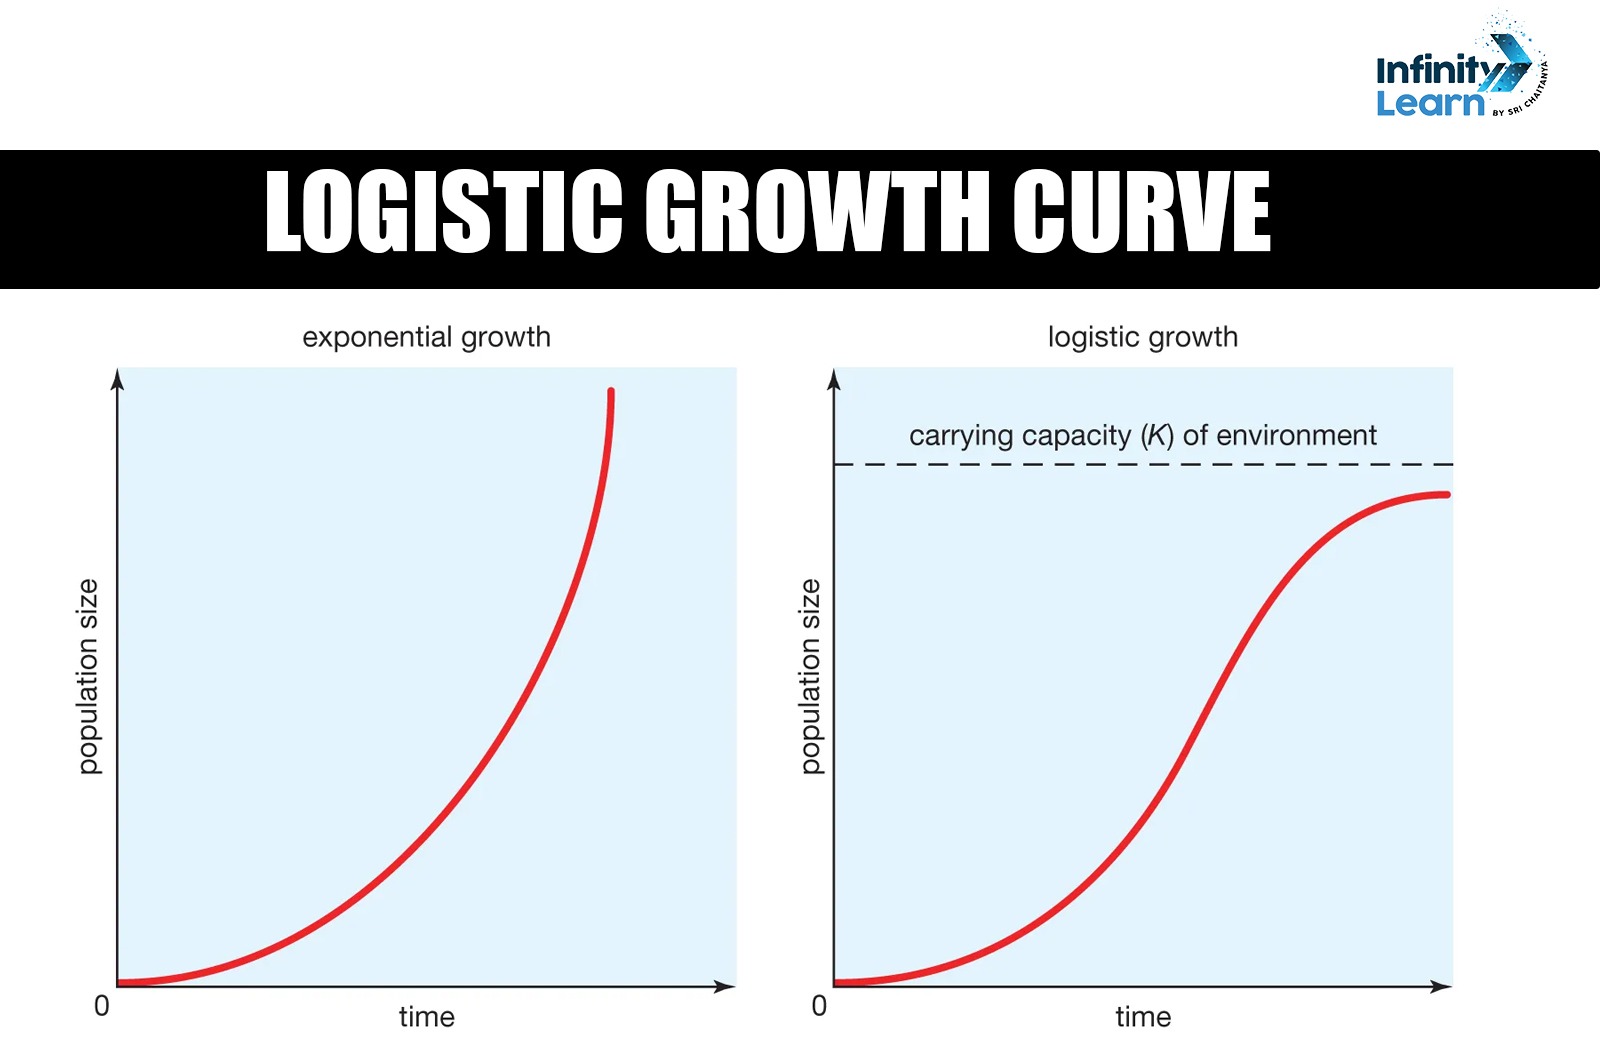
The logistic growth curve represents population growth in a limited environment. Initially, population growth is exponential, but as resources become scarce, growth slows and eventually reaches a stable equilibrium. This S-shaped curve is important for understanding the dynamics of real-world populations and how carrying capacity limits growth. This graph is often tested in the ecology section of NEET.
5. Photosynthesis Rate vs. Light Intensity/CO2 Concentration
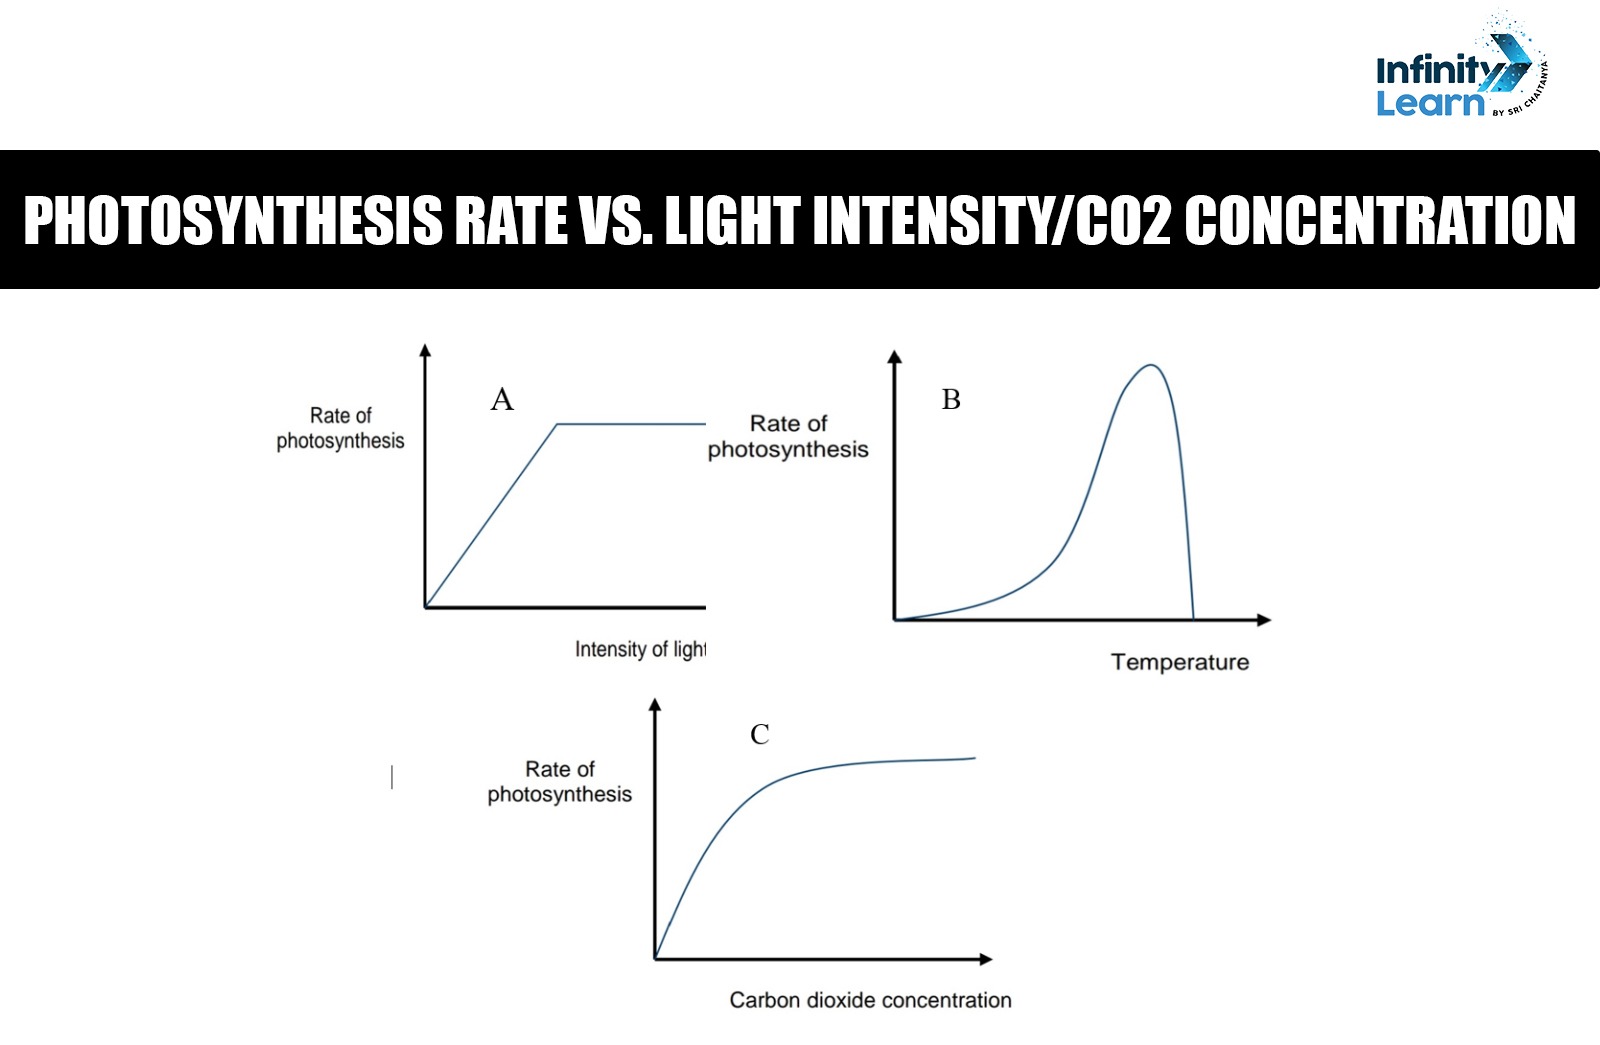
This graph shows the rate of photosynthesis as influenced by varying light intensity or CO2 concentration. As light intensity or CO2 concentration increases, the rate of photosynthesis initially rises and then plateaus at a maximum level. This graph is crucial for understanding the factors that affect photosynthesis, a key topic in plant physiology for NEET.
6. Survivorship Curves
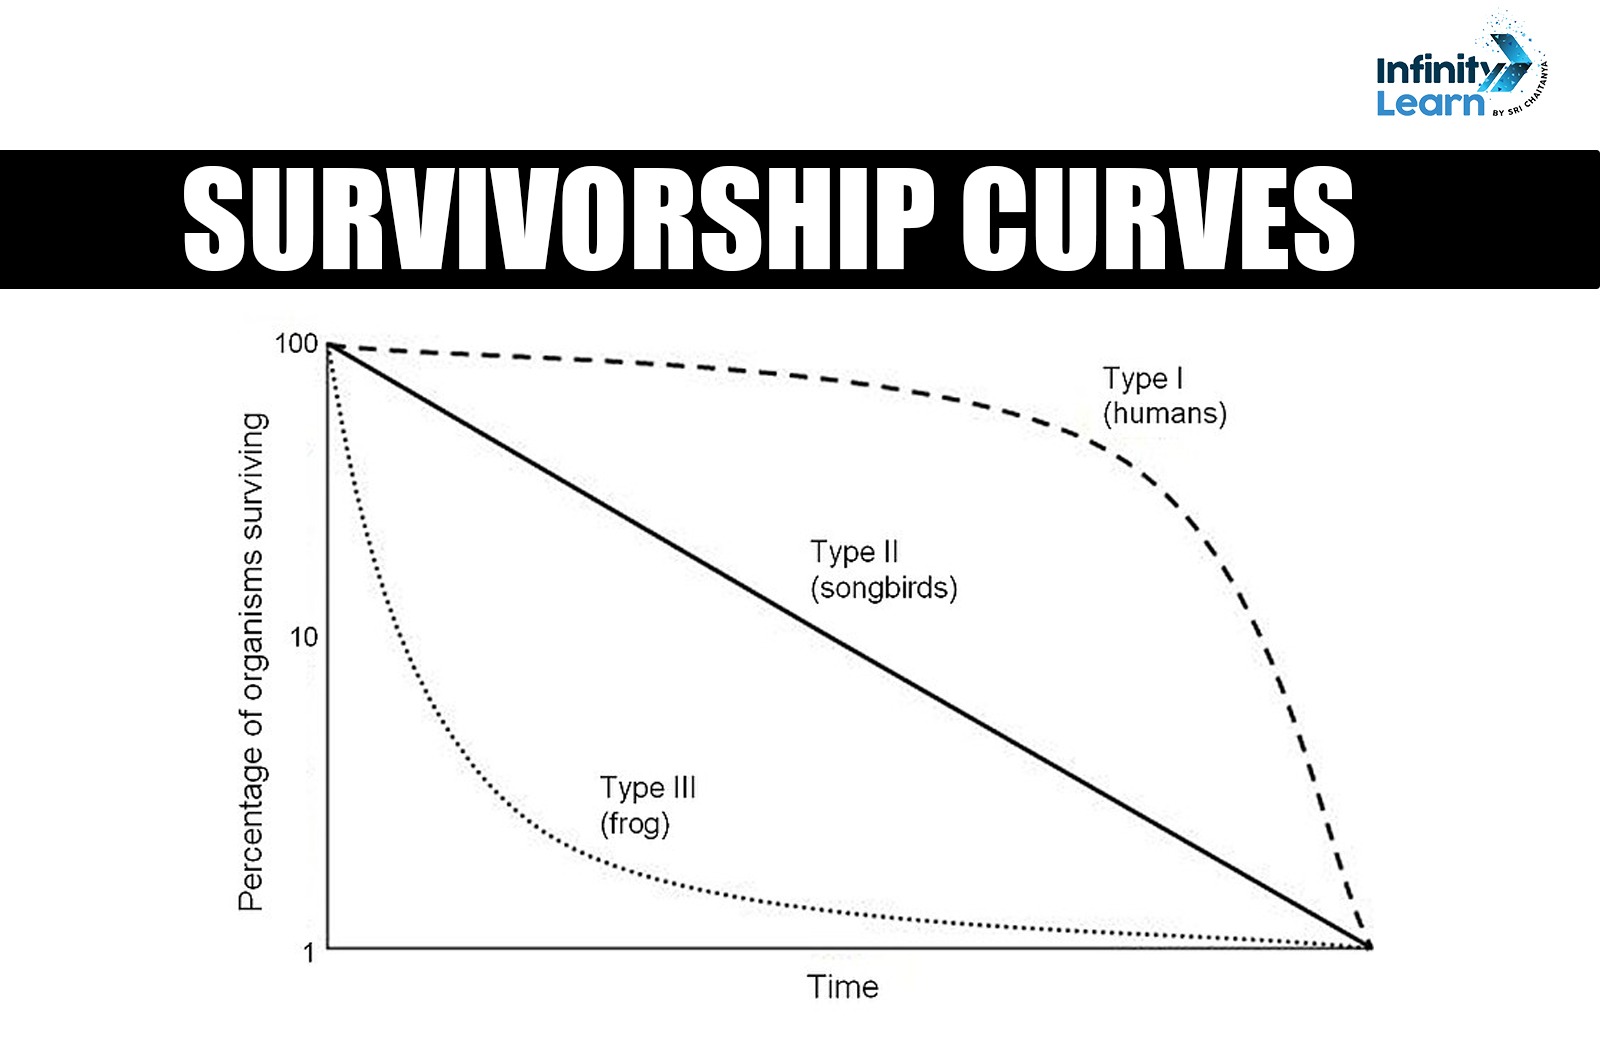
Survivorship curves represent the survival patterns of a population over time. Type I curves show high survival rates in early and middle life (e.g., humans), Type II curves indicate a constant death rate (e.g., birds), and Type III curves display high mortality early in life (e.g., plants and fish). These curves help explain life history strategies and are important for the ecology portion of NEET.
Conclusion
These graphs not only help students visualize biological processes but also enable them to interpret data effectively, which is crucial for solving NEET questions. Whether it’s understanding enzyme kinetics, population dynamics, or the physiology of organisms, these graphical representations are indispensable tools for students preparing for NEET 2025.
Important Graphs in Biology for NEET 2025 FAQs
Are graphs important for NEET?
Graphs are crucial for NEET, especially in the field of biology. By graphically illustrating facts like population increase, oxygen dissociation, and enzyme kinetics, they make difficult biological topics easier to understand. A crucial component of the NEET exam are questions based on graphs, which aid in evaluating a student's aptitude for interpreting and analysing biological data.
Has anyone scored 360 in NEET biology?
Yes, several students have achieved a perfect score of 360 in NEET biology. With thorough preparation, a deep understanding of NCERT textbooks, and consistent practice with mock tests, it is possible to score full marks in the biology section. Many toppers have demonstrated this by mastering the subject’s theoretical and conceptual aspects.
What are graphs used for in biology?
Graphs are used in biology to show the correlations between various factors, including population growth over time or the relationship between enzyme activity and temperature. They facilitate the interpretation of experimental data and the prediction of outcomes by assisting in the knowledge of biological processes' trends, patterns, and correlations. In fields like genetics, ecology, physiology, and metabolism, graphs are essential.
Is there any chance that graph-based questions will appear in NEET soon?
Yes, there is a strong possibility that graph-based questions could feature more prominently in upcoming NEET exams. NEET often tests students' ability to analyze and interpret data, and graphs are an essential tool in biology for visualizing complex processes. Given the increasing focus on application-based learning, future exams may include more questions based on graphs like enzyme kinetics, population dynamics, and the oxygen dissociation curve. Preparing for graph-related questions can help students strengthen their problem-solving skills and better understand key biological concepts.

