
Table of Contents
CBSE Sample Papers for Class 12 Economics Outside Delhi – 2008
Time allowed : 3 hours Maximum marks 100
GENERAL INSTRUCTIONS
(i) All questions in both the sections are compulsory.
(ii) Marks for questions are indicated against each.
(iii) Questions No. 1-5 and 17-21 are very short-answer questions carrying 1 nick each. They are required to be answered in one sentence each.
(iv) Questions No. 6-10 and 22-26 are? short-answer questions carrying 3 marks each. Answers to them should normally not exceed 60 words each.
(v) Questions No. 11-13 and 27-29 are also short-answer questions carrying 4 marks each. Answers to them should normally not exceed 70 words each.
(vi) Questions No. 14-16 and 30-32 are long-answers questions carrying 6 marks each. Answers to them should normally not exceed 100 words each.
(vii) Answers should be brief and to the point and the above word limit should be adhered to as far as possible.
SET I
SECTION A
Question.l. Define ‘Marginal Rate of Transformation’.
Answer. Marginal Rate of Transformation is the rate at which one more unit of any good X is substituted for good Y. Symbolically,
MRT=\(\frac { \Delta Y }{ \Delta X }\)
Question.2. What is a demand schedule?
Answer. It is a two-column table which indicates various quantities demanded corresponding to various market prices.
Question.3. Define ‘production function’.
Answer. Production function explains the relationship between factor inputs and output under given j technology.
Question.4. What is ‘market supply’.
Answer.It is the total supply of a product (commodity) of all the producing firms at a given price at a given time.
Question.5. Define ‘equilibrium price’.
Answer. The price, where quantity demanded and quantity supplied are equal, is equilibrium price.
Any price other than this will lead to a situation of either excess demand or excess supply.
Question.6. Explain the central problem of ‘choice of technique’.
Answer. A number of techniques are available for producing a commodity, such as more of labour and less of capital or less of labour and more of capital. Therefore, a firm has to decide as } to which technique should be used for producing a commodity. This choice is made because
of the difference in the availability of resources. The technique, which is the cheapest, should be used. If labour is abundant and cheap, labour intensive technology would lead to cost effective production.
In case labour is scarce and costly, capital intensive technology would be used.
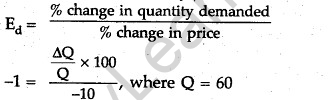
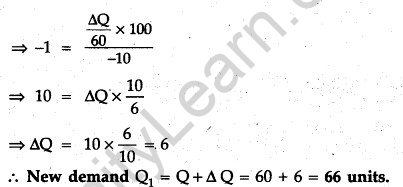
Question.7. Price elasticity of demand of a good is (-) 1. At a given price the consumer buys 60 units of the good. How many units will the consumer buy if the price falls by 10 per cent?
% change in quantity demanded
Answer.
Question.8. Given the market price of a good. How does a consumer decide as to how many units of that good to buy? Explain.
Answer. This is a question which signifies as to how consumers equilibrium is established in the case of a single commodity. It cannot be decided at the point of equality of price and marginal utility of the commodity because these two variables are incomparable. Therefore, the equilibrium will be established at a point where price of the commodity is equal to its marginal utility in money form i.e., \({ MU }_{ x }\) = \( MU }_{ m }\)
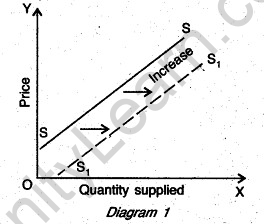
Question.9. What is the likely effect on the supply of a good if the prices of the inputs used in production of that good fall? Explain.
Answer. Fall in the prices of inputs decreases the cost of 8 production as a result of which supply will increase. In such a case, as shown in Diagram 1, a shift towards right takes place in the supply curve.
Question.10. Explain what happens to the profits in the long run if the firms are free to enter the industry.
Answer. In the long run the firm will earruoQly normal profit (AR = AC) when new firms are free to enter the industry. This is so because if existing firms are earning abnormal profit (AR > AC) entry of new firms will increase the supply leading to decline in price. As a result of this excess of AR over AC will disappear and firms will get only normal profits.
(or)
Explain what happens to losses in the long run if the firms are free to leave the industry.
Answer. In the long run, if the firms are free to leave the industry, the existing firms will not sustain losses and earn only normal profits. This is so because in the case of losses few firms will leave the industry leading to decline in supply and increase in price. Ultimately, it will create a situation of normal profit.
Question.11. Explain producer’s equilibrium using a schedule. Use total cost and total revenue approach.
Answer. See Q. 11, 2008 (I Delhi)
Or
Distinguish between (i) fixed cost and variable cost giving examples and (ii) average cost and marginal cost giving an example.
Answer. (i) Fixed Cost: It is the cost which remains fixed and does not change with the change in , the level of output, such as rent of the building.
Variable Cost: It is the cost which varies directly with the changes in the level of output, such as cost of raw material. This cost will be zero when level of output is zero.
(ii) Average Cost: It is the cost which is obtained by dividing the total cost (TC) by the number of units produced. In shorty
\(AC=\frac { TC }{ Number\quad of\quad units\quad produced } \)
Marginal Cost (MC): The change in total cost that takes place by producing an additional unit is marginal cost. In short, MC = TC(n units) – TC(n-1 units).
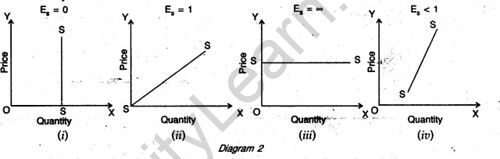
Question.12. Draw supply curves with price elasticity of supply throughout equal to (i) zero, (ii) one, (iii) infinity and (iv) less than one.
Answer.
For Blind Candidate only in lieu of
Question. No. 12 Distinguish between (i) elastic and inelastic supply and (ii) perfectly elastic and perfectly inelastic supply.
Answer. (i) When proportionate change in supply is more than the proportionate change in price, the supply is elastic or >1.
On the other hand, when proportionate change in supply is less than the proportionate .change in price, the supply is inelastic or <1.
(ii) When supply changes to any extent without changes in price, the supply is perfectly elastic. On tire other hand, if supply does not change and remains fixed when price changes, supply is said to be perfectly inelastic, i.e., es = 0.
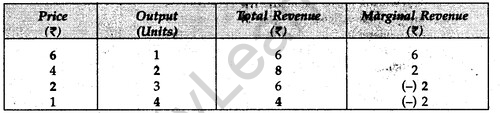
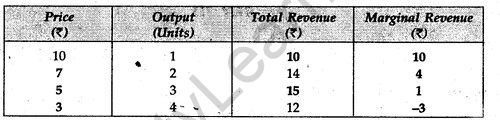
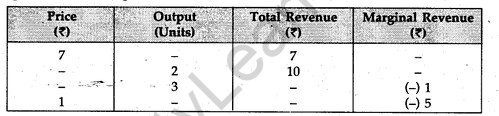
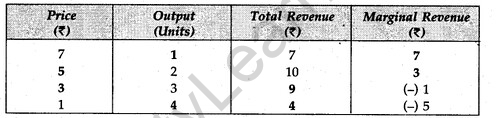
Question.13. Complete the following table:
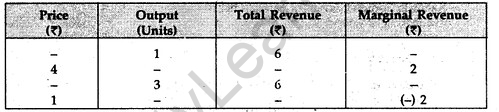
Answer.
Question.14. Explain the effect of the following on demand for a good:
(i) Rise in income
(ii) Rise in prices of related goods
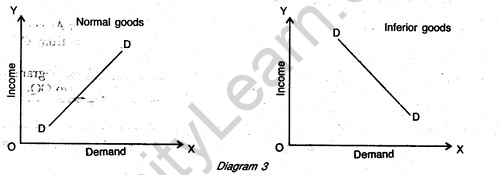
Answer. (i) Effect of rise in income on the demand for a good. Due to the direct relationship between income and demand, the income demand curve rises upwards to the right. However, this is not true in the case of ail the commodities. When income rises the demand for normal and superior goods rises and the demand for inferior goods declines. Thus, as shown in Diagram 3, the income demand curve of normal goods rises upwards to the right and demand curve for inferior goods slopes downwards to the right .
(ii) Effect of rise in the prices of related goods. Related goods can be of two types (i) substitute goods and (ii) complementary goods. Substitute goods are those which can be used in place of one another such as tea and coffee. Complementary goods are those which cannot be used without one another, such as car and petrol.
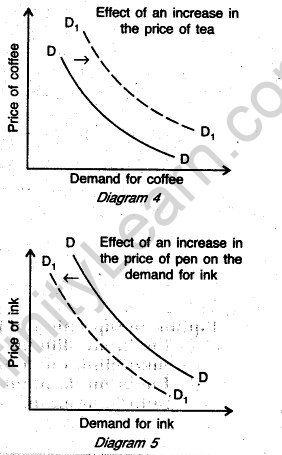
When the price of a a commodity changes, it ‘ affects the demand far its substitute goods in the opposite manner. For example, if the price of tea increases, its demand will fall but the demand for coffee will increase because’it becomes cheaper in comparison to tea. Thus, as shown in Diagram 4, a shift in demand curve for coffee will lake place towards right when price of tea rises.
If the. price of a good rises (say pen), its demand falls. Thus rise in the price of pen will affect the demand for ink in the same maimer because it is a complementary good. Thus, when the price of a good increases, its demand falls and the demand of its complementary good also falls This is being shown in Diagram 5.
Question.15. Explain, with the help of numerical examples, the effect on total output of a good when all the inputs used in production of that good are increased simultaneously and in the same proportion.
Answer. (Out of syllabus, for 2012 examination and or if flards )
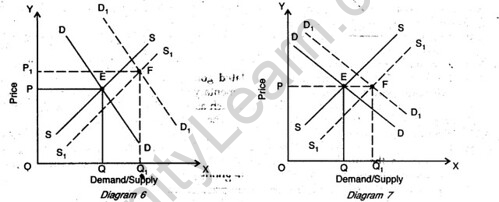
Question.16. Given market equilibrium of a good, what are the effects of simultaneous increase in both demand and supply of that good on its equilibrium price and quantity.
Answer. Market equilibrium of a good is established at a point where quantity demanded is equal to quantity supplied. However, if changes take place in demand and supply,’equilibrium price and quantity are affected in accordance with changes in demand and supply* If demand and supply both increase, their effect on price and quantity can be examined under three situations as given below:
(i) When increase in demand is more than the increase in supply: As shown in diagram 6, price and quantity both will increase. Price will increase from OP to OP, and quantity will increase from OQ to OQ1.
(ii) When increase in demand and supply is equal: As shown in diagram 7, price will in Diagram 8, price will fall and quantity will increase. Price will decline from OP to OP, and quantity will increase from OQ to OQ.
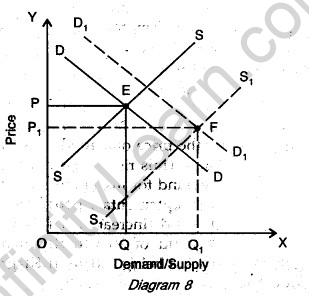
(iii) When increase in demand is less than the
increase in supply: In this case, as price will in Diagram 8, price will fall and quantity will increase. Price will decline from OP to OP, and quantity will increase from OQ to OQ.
(or)
Explain the implications of the following:
(i) The feature ‘differentiated products’ under monopolistic competition.
(ii) The feature Targe number of sellers’ undeir perfect competition.
Answer. (i) Under monopolistic competition, products are differentiated on the basis of their size, packing, colour, smell, brand name, etc., such as different kinds of tooth pastes. These are artificial differences created with a view to make a consumer habituated by using a particular brand of a commodity. With the result, even when the price of the brand commodity that the customer is used to, goes up, he does not reduce his demand for that. As such, because of product differentiation the firms have some price control. (ii) Under perfect competition, the number of buyers and sellers of the commodity is very large, it is so large that no individual buyer or seller can influence the price of commodity. The price is fixed by the supply and demand of the whole industry and the, s^, .determined price is accepted by all the firms. As a result of this aspect of perfect competition, a firm gets only normal profit in the long run. In the event of price (AR) being higher than cost (AC), few firms will join the cornpetition, On tiie other hand, in the event of loss, few firms will leave the competition. In both the cases, profits will be normal.
SECTION-B
Question.17. Define ‘aggregate supply’.
Answer. It is the total value of goods and services produced in an economy at a given time.
Question.18. Give meaning of deficient demand.
Answer. It signifies deficiency in aggregate demand in comparison to aggregate supply at the full employment level.
Question.19. What is a commercial bank?
Answer. It is an institution which deals in money and credit.
Question.20. Define government budget.
Answer. A government budget is a statement of estimated receipts and expenditure prepared annually for a fiscal year.
Question.21. What is fixed exchange rate system?
Answer. It is a system under which exchange is officially fixed and declared. This means exchange rate is fixed and does not vary with the changes in the demand for and supply of foreign currency. Only the government has the power to change it.
Question.22. Calculate Net Value Added at factor cost from the following data:
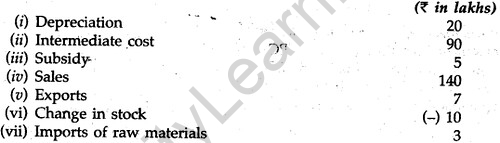
Answer. Net Value Added at FC
= Sales + Change in stock + Exports – Import of raw. material + Subsidy – Intermediate cost – Depreciation
= (iv) + (vi) – (v) – (vii) + (iii) – (ii) – (i)
= 140 + (-10) + 7-3 + 5 – 90 – 20
= 152 – 123 = Rs. 29 lakhs.
Question.23. When exchange rate of foreign currency falls, its demand rises. Explain, how.
Answer. There is an inverse relationship between the foreign exchange rate and the .demand for foreign exchange. This means higher the foreign exchange rate, lower is the demand for foreign exchange and vice-versa. If the foreign exchange rate falls, this means that in
exchange of the given amount of horde currency more foreign exchange is available. If foreign exchange becomes cheaper, its demand will increase. For example, if external value of dollar in Indian rupee falls from Rs. 50 to Rs. 40, more goods can be obtained with the given amount of home currency, therefore demand for foreign exchange will increase.
Question.24. Distinguish between balance of trade and balance on current account.
Answer. Balance of trade relates to the payments made and received on account of import and export of goods only, i.e., visible items. However, balance on current account, besides including balance of trade, also includes payments relating to invisible items Mid hrdlateral transfers. Thus, balance on current account is a broader term in comparison to balance of trade.
Question.25. Explain the’medium of exchange’function of money.
Answer. An important function of money is that it functions as a medium of exchange. It facilitates transactions of goods and services. Producers sell their goods to the Wholesalers in exchange of money. Wholesalers sell the same goods to the consumers in exchange of money. In the same way, all sections of society sell their services in exchange of money and with that money buy goods and services which they need. Money, working as medium of exchange, has eliminated inconvenience which was faced in barter transactions. However, bank money can operate as medium of exchange’only when it is generally accepted in that role. Bank money can be treated as money simply on the basis of its general acceptability for it is highly useful.
Or
Explain the evolution of money.
Answer. (Out of syllabus, for 2011 examination and onwards)
Question.26. Give meaning of capital expenditure and revenue expenditure in a government budget.
Answer. Capital expenditure. An expenditure which results in the creation of assets or reduction in liabilities is treated as capital expenditure, such as expenditure incurred on construction of buildings, roads, bridges, etc.
Revenue expenditure. An expenditure which does not result in creation of assets or reduction of liabilities, is called revenue expenditure such as payments of salaries, pensions, etc.
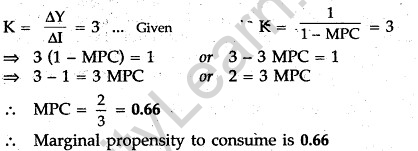
Question.27. In an economy an increase in investment leads to increase in National Income which is three times the increase in investment. Calculate marginal propensity to consume.
Answer.
Question.28. Explain the lending function of commercial banks.
Answer. (Out of syllabus, for 2012 examination and onwards)
(or)
Explain ‘banker to the government’ function of central bank.
Answer. Banker to the government. Central bank is a banker, agent and financial advisor to the government. As a banker to the government, it carries out all banking business of the government. As an agent to the government, it buys and sells securities on behalf of the government. As a financial advisor, the central bank advises the government from time to time on economic, financial and monetary matters.
Question.29. What is revenue deficit? What are its implications?
Answer. The excess of government total revenue expenditure over its revenue receipts is revenue deficit.
![]()
If revenue deficit occurs or increases, it is a warning signal for the government. In such a situation the government either should jreduce the revenue expenditure or should increase revenue receipts. Since most of the States1 are Welfare States, both these measures are difficult to be adopted. However, the deficit is to be met somehow. Therefore, in such a situation the only way available to the government is to increase capital receipts, such as borrowing, , disinvestment, etc.
Question.30. Calculate ‘National Income’ and ‘Private Income’ from the following data:
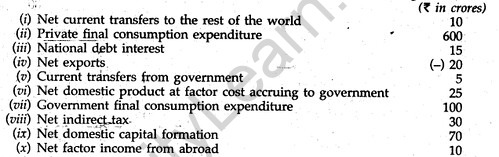
Answer. National Income:
= Private final consumption expenditure + Government final consumption expenditure + Net domestic capital formation + Net exports – Net indirect tax + Net factor income from abroad
= (ii) + (vii) + (ix) + (iv) – (viii) + (x)
= 600 + 100 + 70 + (-20) -30 + 10 = 780 – 50 = Rs. 730 crores Private Income
= National Income + National debt interest + Current transfers from government – Net domestic product at factor cost accruing to government – Net current transfers to the rest of the world
= 730 + (iii) + (v) – (vi) – (i)
= 730 + 15 + 5 – 25- 10 = 750 – 35 =Rs.715 crores
Question.31. Explain ‘consumption function’ with the help of a schedule and diagram.
Answer. Consumption expenditure depends uponirtebtne, i.e. “Consumption is the function of income. Therefore, consumption function.explains the Relationship between consumption expenditure and income.” In other-words, consumption function explains as to what kind of changes will take place in consumption expenditure when income changes. The Income-Consumption Schedule, given in the table (on the next page) indicates the relationship between consumption expenditure and income.
The consumption function may be represented by the following equation:
C = [/latex]\bar { C }[/latex] +BY
Where, c = Autonomous amount. It is the minimum amount which
consumers have to spend irrespective of the level of income b – Marginal propensity to consume (MPC)
Y = Level of income
C= Consumption expenditure
Thus, if Y = 500, b = 0.8 and [/latex]\bar { C }[/latex] = 50,
then;CL= [/latex]\bar { C }[/latex] + bY = 50 + 0.8 x 500
= 50 + 400 = 450
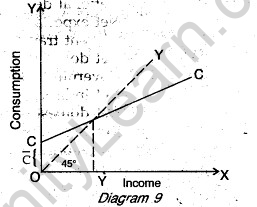
In this way, corresponding to any level of Y (income), nature of C (consumption) can be ascertained. The concept of consumption function can be better comprehended looking at the schedule and Diagram 9 given on the next page.
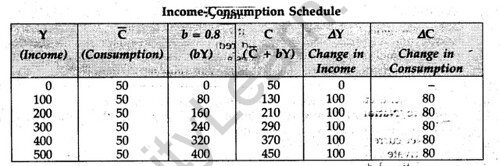
Since there is autonomous consumption (c), therefore CC curve does not start from the point of origin. Upto OY level of income, consumption is greater than income and beyond that it is less than income because with the increase in income savings are also being made.
(or)
Explain ‘saving function’ with the help of a schedule and diagram.
“Saving is that part of income which is not spent on current consumption.” In other words, saving means the difference in income and cqpsumption expenditure. In the form of an equation: Saving (S) = Income (Y) – Consumption (C) or S = Y-C
Saving function or propensity to save explains the relationship between saving and income. Like consumption function saving function is also a schedule of saving and income which expresses the amounts of saving at various levels of income.
Consumption expenditure is never zero,_not even when income is zero. In the beginning, when income increases, consumption also increases but consumption is more than income. Therefore, till the point where consumption, is more than income, saving is negative. This.is so because consumption being more than income, past savings are used.
With the increase in the level of income consumption and income become equal at some level and at this level saving is zero.
In the table given on page 24, when income is Rs. 100 saving is zero, but after this level saving starts becoming positive. The reason is very simple. After the level of income of Rs. 100, consumption is less than income and the difference between the two is saving. Therefore, when the level of income increases to Rs. 200, consumption expenditure increases to Rs. 150 and saving becomes Rs. 50. In the same way, when income is Rs. 300, consumption increases to Rs. 200 and saving increases to Rs.100.
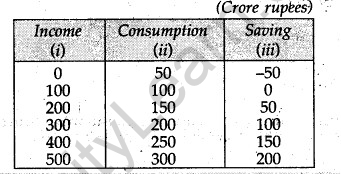
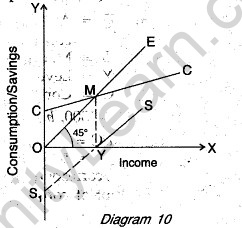
Saving function can be explained with thehelpof diagram 10 on page 23. In Diagram 10, OE is 45°, i.e., line of equality and CC is consumption curve. Till OY level of income, consumption is greater than income and after that it is less than income, therefore, till OY level of income, saving is negative and after that it becomes positive. Because of that, saving curve \({ S }_{ 1 }\)S starts not from the point of origin but from below that.
For Blind Candidates only in lieu of
Question. No. 31 Explain ‘consumption function’ with the help of a schedule. Also record marginal propensity to consume in the schedule.
Answer. See Q. 31 above for regular students.
Or
Explain ‘savingftinction’ with the help of a schedule. Also record marginal propensity to save in the schedule.
Answer. See Q. 31 (Or) above for regular students.
Question.32. Giving reasons, explain how the following are treated in estimating National Income:
(i) Wheat grown By a farmer but used entirely for family’s consumption.
(ii) Earnings of the shareholders from the sale of shares.
(iii) Expenditure by government on providing free education.
Answer. (i) It is production for self consumption, hence it will be included in National Income. . Production for self consumption is part of National Income.
(ii) These are not included, because these are financial transactions and do not relate to flow of goods and services.
(iii) It will be included in National Income because it is a part of government’s final consumption expenditure.


SET II
Note : Except for the following questions, all the remaining questions have been asked in Set l.
SECTION A
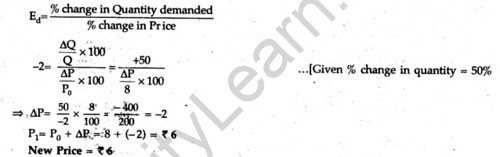
Question.6. Price elasticity of demand for a good is (-) 2. The consumer buys a certain quantity of this good at a price of Rs. 8 per unit. When the juice falls he buys 50 per cent more quantity. What is the new price?
Answer.
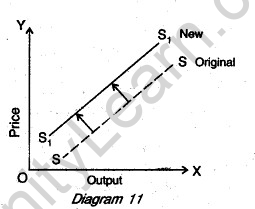
Question.8. What is the likely effect on supply of a good if a unit tax is imposed on that good? Explain.
Answer. A unit tax is a tax which the government levies per unit sold or produced. This tax naturally increases the cost of production of the firm for every unit of output produced. As a result of this, marginal cost of every unit increases. This leads to a shift in supply curve towards left, as shown in Diagram 11.
Question.10. Explain the central problem of the choice of products to be produced.
Answer. Because of scarcity of resources each and every commodity that we want cannot be produced. Therefore, it has to be decided as to which commodities should be produced and in what quantity. Should we produce goods for consumption or for military purposes. Similarly, it may be decided that we should produce either luxury goods or goods meant for general public. Actually speaking, this problem is resolved by the introduction of the forces of supply and demand of the commodity/commodities and price mechanism.
Question.11. Complete the following table:
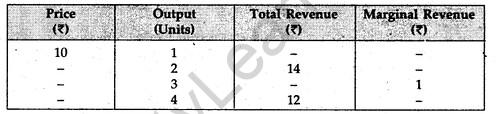
Answer.
SECTION B
Question.27. What is fiscal deficit? What are its implications?
Answer. See Q.29, 2008 (I Delhi).
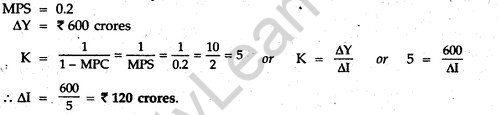
Question.28. If marginal propensity to save is 0.2, how much new investment is required to make the National Income rise by Rs. 600 crores? Calculate.
Answer. MPS = 0.2
Question.31. Calculate ‘Gross National Product at Market Price’ and ‘Personal Income’ bom the following data:
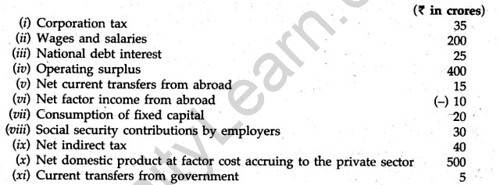
Answer. \({ GNP }_{ MP }\)
= Wages and salaries + Social security contributions by employers + Operating surplus + Net factor income earned from abroad + Consumption of fixed capital + Net indirect
tax
= (ii) + (viii) + (iv) + (vi) + (vii) + (ix)
= 200 + 30 + 400 + (-10) + 20 + 40 = 690 – 10 = Rs. 680 crores Personal Income
= Net domestic product at factor cost accruing to the private sector + National debt interest + Net current transfers from abroad + Current transfers from government – Corporation tax + Net factor income from abroad = (x) + (iii) + (v) + (xi) – (i) + (vi)
= 500 + 25 + 15 + 5 – 35 + (-10) = 545 – 45 = Rs. 500 crores.
SET III
Note: Except for the following questions, all the remaining questions have been asked in Set I and Set II.
SECTION A
Question.7. What is the likely effect of technological progress on the supply of a good? Explain,
Answer. See Q. 9, 2008 (I Delhi)
Question.9. Explain the central problem of distribution of income.
Answer. Due to scarcity of resources, goods cannot be produced for everybody. Therefore, it has to be decided as to for whom goods should be produced.
This problem relates to how goods and services produced in the economy should be distributed. The distribution 6f the product is according to the ability to buy, i.e., income of the person or his purchasing power.
The question ‘for whom to produce’ actually relates to the distribution of income generated from production of output. Incomes are distributed in the form of factor earnings, i.e., wages, : rent, interest and profit. Hence it is also called the problem of functional distribution of income.
In a capitalist economy, it is observed that price mechanism facilitates more production of luxuries meant for rich people and less production of goods of mass consumption meant for poor people.
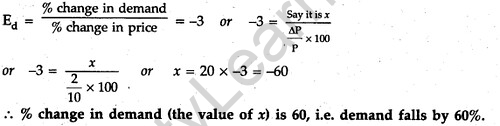
Question.10. Price elasticity of demand of a good is (-) 3. If the price rises from Rs. 10 per unit to Rs. 12 per unit, what is the percentage change in demand?
Answer.
Question.12. Complete the following table:
Answer.
SECTION B
Question.25. Calculate ‘Gross Value jf^dded at Factor Cost’ from the following data:
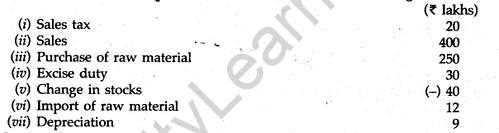
Answer. Gross Value Added at Factor Cost (GVAPC)
= Sales + Change in stock Sales tax – Excise duty – Purchase of raw material
= (ii) + (v) – (i) – (iv) – (iii)
= 400 + (-40) – 20 – 30 – 250 = 400 – 340 = Rs. 60 lakhs
Question.28. Distinguish between:
(i) balanced budget and surplus budget
(ii) developmental expenditure and non-developmental expenditure
Ans. (i) Balanced budget and surplus budget
Balanced budget signifies a situation when estimated receipts and expenditure of the government are equal. On the other hand, surplus budget signifies a situation when estimated receipts are more than the estimated expenditure of the government. In real world, we find neither the situation of balanced budget nor of surplus budget. What we find is a situation of deficit budget where proposed receipts are less than the proposed expenditure and the deficit is financed through borrowings. The main cause of such a situation is the nature of modem States which are Welfare States, where government cannot think of spending less, rather expenditure keeps on increasing, (ii) Developmental expenditure and non-developmental expenditure
The expenditure which is incurred on activities directly related to economic development is called developmental expenditure. Hence expenditure incurred on education, health care, scientific research, infrastructure (such as construction of roads, bridges, dams, etc.) is developmental expenditure.
Expenditure incurred on general essential services required for normal running of the government is regarded as non-developmental expenditure. Expenditure incurred on services related to general administration, police, defence, judiciary etc. come under non-developmental expenditure.
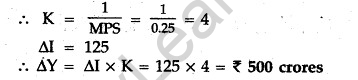
Question.29. Given the marginal propensity to save is equal to 0.25. What will be the increase in national income investment increases by Rs. 125 crores? Calculate.
Answer. MPS = 0.25
Question.32. Calculate ‘Net National Product at Market Price’ and ‘Private Income’ from the following, data:
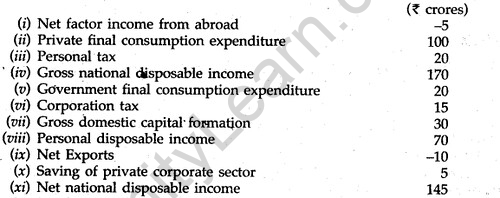
Answer. Net National Product
Private final consumption expenditure + Government final consumption expenditure + Gross domestic capital formation + Net exports + Net factor income from abroad – Gross national disposable income + Net national disposable income = (ii) + (v) + (vii) + (ix) + (i) – (iv) + (xi)
= 100 + 20 + 30 + (-10) + (-5) – 170 + 145 = 295 – 185 = Rs. 110 crores Private Income
= Personal disposable income + Personal tax + Corportion tax + Saving of private
corporate sector
= (viii) + (iii) + (vi) + (x)
= 70 + 20 + 15 + 5 = Rs. 110 crores
