
Table of Contents
- Example
- What’s Next
In the previous segment, we learnt how to draw a Percentage Bar Diagram. In this segment, we will learn about the same with the help of an example.
Example
Consider the following figure for the questions below:
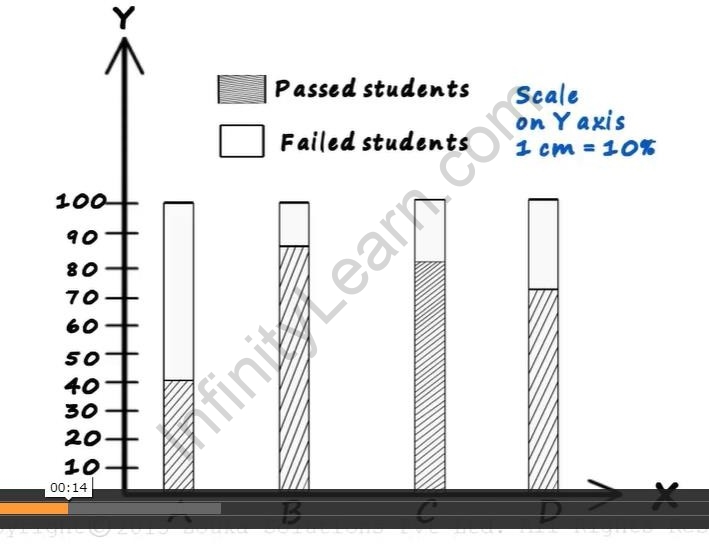
Fig. 1
Q. Which division has the highest percentage of students who passed?
Solution:
Division B has the highest percentage of students who passed.
Q. What percentage of students passed in division C? Solution:
Approximately 80% of the students passed in division C.
Q. What percentage of students in division D did not pass?
