
Table of Contents
Velocity-Time Graphs and Position-Time Graphs:
Learning numerical physics with the aid of equations and derivations can be tedious. Still, with the aid of graphs, it becomes both entertaining and simple to comprehend what the answer is explaining. In Physics, graphs are extremely important because they are used in almost every topic. In physics, graphs are required because they are the most practical and powerful technique for displaying data.
Although both tables and graphs describe the same data, graphs are easier to read and interpret than tables. A graph can demonstrate how the variables (dependent and independent) change as a result of physical laws. Without further computations, a graphical depiction of any data can provide a qualitative relationship between the variables. Tables and graphs can be used to represent data, but graphs are far easier to alter and analyze than tables.
The information about the velocity-time and position-time graphs from various physics-related articles is available here. Graphs and their types are important topics in physics. Students who want to flourish in physics need to well know about velocity-time graphs and position-time graphs to get deep knowledge about it to do well on their exams. The definitions, diagrams, and brief explanations are provided here to assist students in effectively understanding the respective topic. Continue to visit our website for additional physics help.
Overview
The main distinction between graph studies and kinematics is that it is done in a graphical format. There are various types of graphs. We’ve learned how to calculate speed, distance, velocity, and displacement using math. These graphics will assist us in better comprehending the action.
According to physics, the observer should be able to interpret motion by seeing the graph. We’ve seen how speed, velocity, distance, and displacement may be mathematically calculated. Graphs, on the other hand, help us understand motion better. From a physics standpoint, looking at graphs should be able to comprehend motion. We’ll primarily discuss velocity and position-time graphs in this section.
- Position-Time (d-t) graph plots an object’s distance from a given position. Here, the X-axis shows time, and the Y-axis represents distance.
- Velocity-Time (v-t) graph: The velocity of an object in motion from a given position was represented by a velocity-time graph. The X-axis represents time, while the Y-axis represents velocity.
- Acceleration-time graph (a-t) determines the change in velocity over time at regular intervals.
Velocity-Time Graphs
The numerous ways in which the motion of objects can be represented have been the focus of our 1-dimensional kinematics research. The use of words, the use of diagrams, the use of numbers, the use of equations, and the use of graphs are all examples of such methods. The shape and slope of the lines on a velocity vs time graph indicate the special aspects of object motion.
Positive velocity is when an object moves in a positive direction, whereas negative velocity refers to when an object moves in a negative direction. When reading the velocity-time graphs closely, it can be seen that the positive velocity is always in the positive part of the graph, that is, above the x-axis, and the negative velocity is always in the negative region, that is, below the x-axis. If, on the other hand, the line appears in both zones of the graph, crossing from positive to negative or vice versa, the item is said to have changed directions.
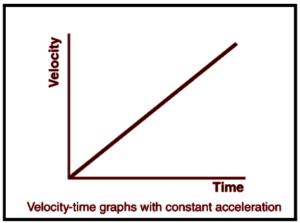
If the velocity-time data for such an automobile were graphed, the resulting graph would look like the one on the right. When plotted as a velocity-time graph, a motion defined as a positive changing velocity produces a sloped line. Positive acceleration is matched by a positive slope line. We can also see that only positive velocity numbers are shown, indicating a motion with a positive velocity.
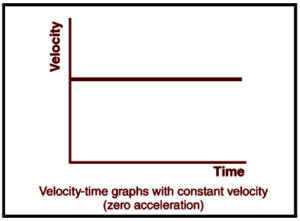
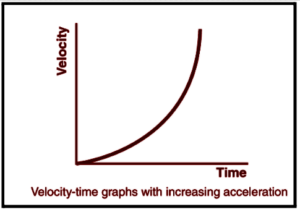
The following is a summary of the velocity vs time graph for the two motion forms: Constant velocity and Changing velocity, which is acceleration. The geometries of the velocity vs time graphs for these two main types of motion – constant velocity motion and motion of acceleration, which is the changing velocity – indicate an important principle. The premise is that the slope of a line on a velocity-time graph exposes extremely useful information about the object’s acceleration. The zero slope is a horizontal line when there is no acceleration.


Position-Time graphs
A derivative of the graph of an object’s position vs time equals the object of velocity in mechanics. According to the International System of Units, the location of a moving object is measured in meters relative to the origin. Time is, on the other hand, measured in seconds. The y-axis represents placement, while the x-axis represents time.
While evaluating the motion of bodies, we use the distance-time graph. The position-time graph relating to the motion of a body can be obtained by recording the distance and time for the motion of a body and plotting the same data on a rectangle graph.
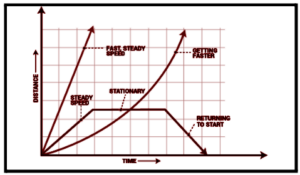
The motion of a body is calculated using a position-time graph. The distance and time corresponding to the body in motion can be calculated by graphing the time and distance of an accelerating body. The gradient line is found in the distance-time graph and is equivalent to the object’s speed. The faster the object moves, the better the gradient line or, in other words, the steeper the line is. The slope of the tangent to the curve at that exact location indicates the speed of the moving object.
Also read: Important Topic Of Physics: Nuclear Fission and Fusion
FAQs – Frequently Asked Questions
Explain what the slope of the velocity-time Graph gives.
The acceleration of an object is represented by the slope of a graph velocity. As a result, we may state that the value of the slope at a given moment represents the object's acceleration at that time. Acceleration is the rate at which velocity changes over time. The slope reflects the acceleration when velocity is plotted with the y coordinates and time is plotted with the x coordinates. Time is an independent variable represented by the x-coordinates, whereas velocity is a dependent variable represented by the y-coordinates. If the acceleration is good, the graph's slope is also good. This can also be used to calculate the numerical value of the object's acceleration.
What is the significance of the positive and negative slope of a velocity-time graph?
The working idea of a velocity-time graph is that the slope of the line on the graph offers information about the object's acceleration. A positive slope on the graph indicates that the object is moving faster (i.e., an upward-sloping line). If the slope is negative, the acceleration, also known as retardation, is negative (i.e., a downward sloping line).
Question: What is the difference between a position-time graph and a velocity-time graph?
Answer: The disparity is thought to be significant.
- The position-time graph shows how far you’ve travelled, while the velocity-time graph shows how fast you’ve moved.
- The rate of change of the position-time graph determines the points on the velocity-time graph.
