
Geography Class 12 Notes Chapter 11 Population: Distribution, Density, Growth and Composition
Distribution of Population
Distribution of population means how population is distributed in any given area. In India, spatial pattern of population distribution is very uneven. As some areas are sparsely populated whereas others are denses. These states can be categorised into three categories:
- State with High Population Uttar Pradesh (highest population), Maharashtra, Bihar, West Bengal, Madhya Pradesh, Tamil Nadu, Rajasthan, Karnataka, Gujarat and Andhra Pradesh. These states together account for 76% of population.
- States with Moderate Population Assam, Haryana, Jharkhand, Chhattisgarh, Kerala, Punjab, Goa.
- States with Low Population Hilly and tribal areas like Jammu and Kashmir, Uttarakhand, Himachal Pradesh, all North-Eastern state (except Assam) and Union Territories excluding Delhi.
Density of Population
Population density means number of person living in per unit area. According to 2011 census, in India 382 person live in per sq km of area. Over the last 50 years the population density has recorded an increase of about 260 persons per sq km, as ranging from 117 persons/sq km in 1951 to 382 persons/sq km in 2011.
Spatial Pattern of Population Density in India
Spatial pattern of population density is also uneven in India. For example:
States/UTs having High Density of population
States Bihar (1106 highest), West Bengal (1028), Kerala (860), Uttar Pradesh (829),
UTs Delhi (11320 highest), Chandigrah (9258).
States/UTs having Moderate Density of Population Haryana (573), Tamil Nadu (555), Punjab (551), Jharkhand (414), Assam (398), Goa (394), Maharashtra (365) Tripura (350).
UTs Dadra andNagar Haveli (700).
States/UTs having Low Density of Population
States Arunachal Pradesh (17 Lowest), Mizoram (52), Jammu and Kashmir (56), Sikkim (86), Nagaland (119).
UTs Andaman and Nicobar islands (46 lowest).
Growth of Population
Growth of population refers to the changes occuring in the number of persons living in a particular area between two points of time. Its rate is expressed in percentage. Two components in population growth afe as follows:
Natural Growth It means the change occuring by the births and deaths in any area.
Induced Growth It means the changes occurred by the volume of inward and outward movement in an area.
Phases of Population Growth
There are four different phases of population growth:
Phase-I (1901-1921) It is stagnant or stationary phase because of very low growth rate.
Phase-II (1921-1951) It is the period of steady population growth.
Phase-III (1951-1981) This period is known as the period of population explosion in India. Rapid fall in death rate and high fertility rate were the main causes of this explosion.
Phase-IV (Post 1981 till present) Growth rate has started down gradually because of downward trend in birth rate. But in developing countries like India, growth rate is still high. According to World Development Report by 2025, Indian population will surpass the figure of 1350 million.
Regional Variation in Population Growth
The spatial pattern of population growth in India is very uneven. It ranges from -0.58% (Negative) in Nagaland to 55.88% in Dadra and Nagar Haveli.
States/UTs having High Growth Rate of Population
States Meghalaya (27.95%), Arunachal Pradesh (26.03%), Bihar (25.42%), Manipur (24.50%), Jammu and Kashmir (23.64%).
UTs Dadra and Nagar Haveli (55.88%), Daman and Diu (53.76%), Puducherry (28.08%).
States/UTs having Moderate Growth Rate of Population Chhattisgarh (22.61%), Jharkhand (22.42%), Rajasthan (21.31%), Madhya Pradesh (20.35%), Uttar Pradesh (20.23%).
States/UTs having Low Growth Rate of Population
States Nagaland (-0.58% lowest), Kerala (4.91%), Goa (8.23%), Andhra Pradesh (10.98%).
UTs Lakshadweep (6.30%), Andaman and Nicobar islands (6.86%).
Growth of Adolescent Population
The United Nation considers person aged 10-19 year as adolescents population. Since 1971, the proportion of adolescent population has remained around 21%. The decadal growth rate of adolescent population of India is 12.5% as per census 2011. India is on 4th place in adolescent population (10-19 years) after Pakistan, Nigeria and Bangladesh. Adolescent population has increased from 85 million in 1961 to 253.2 million in 2011. Sex-ratio of adolescent population of India is 898 females per 1000 males.
The Government of India has taken many steps by some policies like, National Youth Policy 2003, for channelisation and proper utilisation of adolescents by giving them proper education.
Population Composition
It is a detailed analysis of age and sex, place of residence, ethnic characteristics, tribes, language, religion, marital status, literacy and education, occupational characteristics, etc in population geography.
Rural-Urban Composition
In India, its 68.84% of total population lives in rural villages by 2011. According to census 2011, India has 6,40,867 villages.
Percentage of rural population is high in Himachal Pradesh (89.97% highest) and Bihar (88.71%) and low in Goa (37.83%) and Mizoram (47.89%). Delhi has the least rural population (2.50%).
Rural Population in Indian States
States having High Proportion of Rural Population Himachal Pradesh (89.97%) and Bihar (88.71%), Assam (85.90%), Odisha (83.31%).
States having Moderate Proportion of Rural population
Meghalaya (79.93%), Uttar Pradesh (77.73%), Arunachal Pradesh (77.06%), Chattisgarh (76.76%), Jharkhand (75.95%).
States having Low Proportion of Rural Population
States Goa (37.83%), Mizoram (47.89%), Tamil Nadu (51.60%), Kerala (52.30%).
UTs Delhi (2.50%), Chandigarh (2.75%).
Urban Population in Indian States
Regions having High Degree of Urbanisation
States Goa (62.17%), Mizoram (52.11%), Tamil Nadu (48.40%) Kerala (47.70%).
UTs Delhi (97.50%), Chandigarh (97.25%), Lakshadweep (78.07%).
Regions having Low Degree of Urbanisation Himachal Pradesh (10.03%), Bihar (11.29%), Assam (14.10%), Odisha (16.69%), Meghalaya (20.07%).
Linguistic Composition
India is a land of linguistic diversity. According to Grierson (Linguistic Survey of India, 1903-1928) there were 179 languages and as many as 544 dialects in India. But now, there are 22 scheduled languages and number of non-scheduled languages.
Linguistic Classification
The speakers of major Indian languages belong to
four language families, which have their sub-families and branches or groups.
Family
- Austric (Nishada-1.38%)
- Dravidian (Dravida-20%)
- Sino-Tibetan (Kirata-0.85%)
- Indo-European (Aryan-73%)
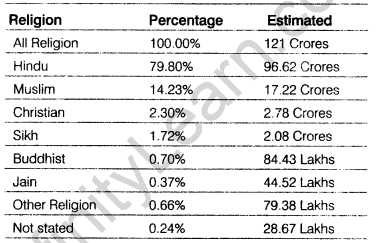
Religious Compositions
All India Religion Census Data 2011
Composition of Working Population
The proportion of working population to total population is called work participation rate.
The population of India according to their economic status is divided into three groups like:
Main workers A person who works atleast 183 days in a year.
Marginal workers A person who works for less than 183 days in a year.
Non-workers A person who does not work and depends upon working class.
According to 2011 census, it is observed that the proportion of workers (both main and marginal) is only 39.8% leaving a vast majority of about 60% as non-workers.
Occupational categories
The 2011 census has divided the working population of India into four major categories:
- Cultivators
- Agricultural labourers – 54.6%
- Household labourers – 3.8%
- Other workers – 41.6% (2011)
We hope the given CBSE Class 12 Geography Notes Chapter 11 Population: Distribution, Density, Growth and Composition will help you. If you have any query regarding NCERT Geography Class 12 Notes Chapter 11 Population: Distribution, Density, Growth and Composition, drop a comment below and we will get back to you at the earliest.
