To Study the Variation in Volume with Pressure for a Sample of air at Constant Temperature by Plotting Graphs Between P and V, and Between P and 1/V


Aim
To study the variation in volume with pressure for a sample of air at constant temperature by plotting graphs between P and V, and between P and 1/V.
Apparatus
Boyle’s law apparatus, plumb line, a pair of set-squares, a thermometer and Fortin’s barometer.
Theory
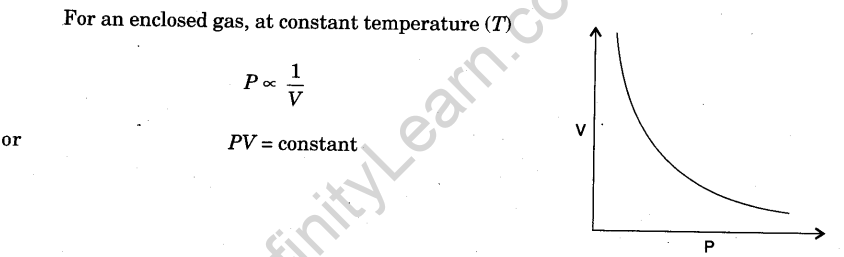
Boyle’s Law. It states that the pressure (P) of an enclosed gas (i.e., for a given mass of the gas) is inversely proportional to its volume (V) provided that the temperature of the gas remains constant.
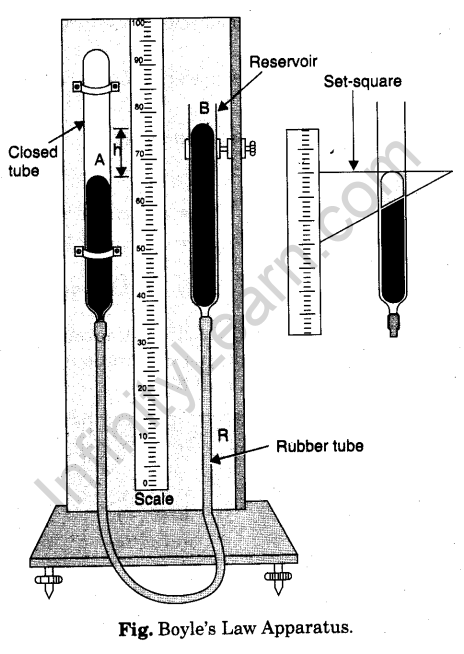
Diagram
Procedure
- The apparatus is set with wooden board vertical with the help of leveling screws in the heavy metallic base. It is tested by a plumb line.
- See the air enclosed in the graduated tube A closed at the upper end.
- Adjust the height of other tube B, such that mercury level in it is in horizontal line with the level in A. Air pressure in A is equal to the atmospheric pressure on mercury in tube B.
- Note the atmospheric pressure from Fortin’s barometer hanging in laboratory.
- Also note the temperature from the thermometer attached to the barometer.
- Note the reading of mercury levels in tube A and B against scale S. It will be same.
- Note volume of enclosed gas in graduated tube A.
- Move the tube B upwards by about 2 cm. Mercury level in tube A will also rise up a little reducing volume of enclosed air. The reduced volume is noted.
- Pressure of air in tube A increases and mercury level in A remains lower than that in B.
- Position of mercury level in tube B is noted against the vertical scale using set squares as before.
- Repeat steps 8, 9, 10 two more times raising the tube B by 2 cm each time.
- Lower the tube B and bring the mercury level with same horizontal line as in A. Check reading of step 6.
- Move the tube B downwards by about 2 cm. Mercury level in A will also come down a little increasing volume of enclosed air. The increased volume is noted.
- Pressure of air in tube A decreases and mercury level in A remains higher than that in B. Step 10 is repeated.
- Repeat steps 13 and 14 two more times lowering the tube B by 2 cm each time.
- Repeat steps 4 and 5.
- Record observations in tabular form as given ahead.
Observations
Calculations
(a) Through Table
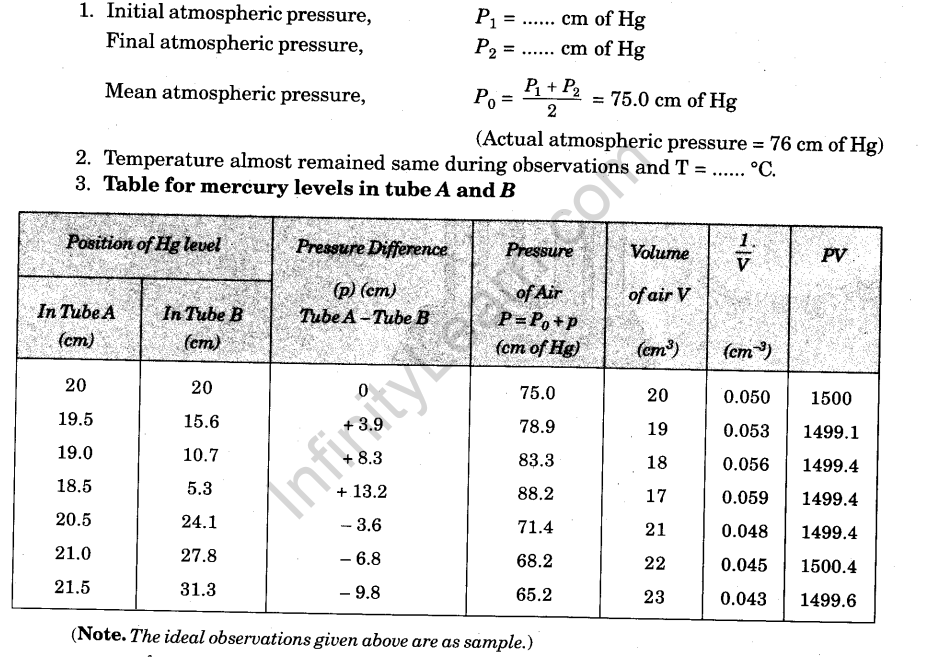
1. Find difference of Hg levels in tube A and tube B to find pressure difference (p).
2. Add atmospheric pressure P0(75.0 cm of Hg) to pressure difference p to find total pressure P(= P0 + p) of air in the tube A.
3. Write volume V of air enclosed in tube A.
4. Write value of 1/V and PV in respective columns.
(b) Through Graph
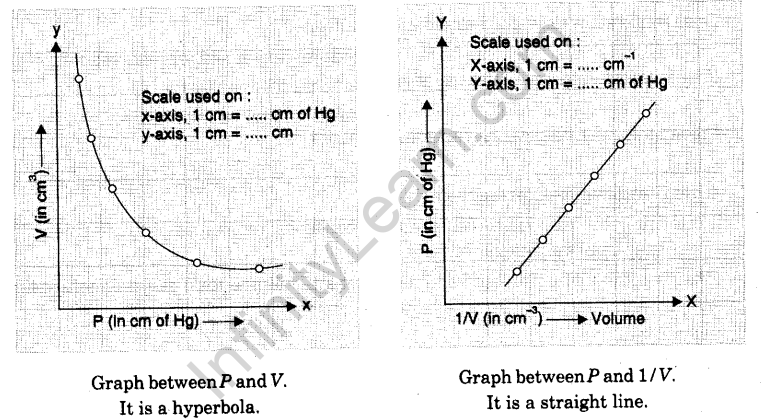
1. Draw a graph between P and V, taking P, along X-axis and V along Y-axis. The graph is a hyperbola.
2. Draw another graph between P and 1/V , taking P along X-axis and y along Y-axis. The graph is a straight line with positive slope.
Result
1. PV is constant. It is according to Boyle’s Law.
2. P-V graph is a hyperbola. It satisfies the relation PV = constant.

Precautions
- Air in tube A must be pure and dry.
- The wooden board must be set vertical.
- Position of mercury levels must be noted using set squares.
- Atmospheric pressure must be taken in the beginning and at the end of the experiment. Its mean must be used in calculation.
- Graph must be plotted carefully.
Sources of error
- The air in tube A may not be pure and dry.
- Base may not be broad and heavy to keep the, apparatus stable.
Viva Voce
Question. 1. State Boyle’s Law.
Answer. Read theory of Experiment 3.
Question. 2. Why do we use the mercury in Boyle’s law apparatus ?
Answer. Pressure difference (P) is in terms of difference of mercury levels in tube A and B. This difference added algebraically to atmospheric pressure gives the pressure of air in tube A in cm of Hg.
Question. 3. Does Boyle’s law hold good under all conditions ?
Answer. No. Boyle’s law is only hold good when temperature is high and pressure is low.
Question. 4. Why is it necessary to make the Boyle’s law apparatus vertical ?
Answer. If it is not vertical, the reading of mercury column will not be accurate.
Question. 5. For which gas have you verified Boyle’s law ?
Answer. For air.
Question. 6. What is atmospheric pressure ?
Answer. It is the pressure on earth surface due to air column Pa = 1.013 x 10⁻⁵ Nm-2.
Question. 7. What is nature of graph between pressure and volume for a gas at constant temperature.
Answer. Hyperbola.
Question. 8. What is nature of graph for P vs. 1/V for a gas at constant temperature ?
Answer. Straight line.
Question. 9. How the pressure depend upon radius of tube A and B?
Answer. Pressure does not depend upon the radius (Area) of tube.
Question. 10. What is ideal gas equation ?
Answer. PV = nRT.


