Table of Contents
Time allowed : 3 hours Maximum marks 100
GENERAL INSTRUCTIONS
- All questions in both the sections are compulsory.
- Marks for questions are indicated against each.
- Questions No. 1-5 and 17-21 are very short-answer questions carrying 1 nick each. They are required to be answered in one sentence each.
- Questions No. 6-10 and 22-26 are? short-answer questions carrying 3 marks each. Answers to them should normally not exceed 60 words each.
- Questions No. 11-13 and 27-29 are also short-answer questions carrying 4 marks each. Answers to them should normally not exceed 70 words each.
- Questions No. 14-16 and 30-32 are long-answers questions carrying 6 marks each. Answers to them should normally not exceed 100 words each.
- Answers should be brief and to the point and the above word limit should be adhered to as far as possible.
SET I
SECTION A
Question.1. Give two examples of microeconomics.
Answer. Demand analysis and price determination of a commodity are two examples of microeconomics.
Question.2. What is meant by consumer’s equilibrium?
Answer. Consumers equilibrium refers to the situation when a consumer spends his gives income on purchase of a commodity in such a way that he is having maximum satisfaction with limited income and has no tendency to change his position if other things remain the same.
Question.3. Define market demand.
Answer. Market demand is the sum of individual demands of a product corresponding to prevailing prices.
Question.4. Define oligopoly.
Answer. Oligopoly is a market situation where there are few sellers and the nature of demand is indeterminate because of interdependence of firms upon one another.
Question.5. Give the meaning of marginal -product.
Answer. Marginal product is the change in total product that takes place by employing an additional unit of a variable factor. In short, \(MP={ TP }_{ (n) }-{ TP }_{ (n-1) }\)
Question.6. Explain the problem of ‘how to produce’.
Answer. The problem of ‘how to produce’ relates to the choice of technique which a producer adopts for producing a commodity. Therefore, in view of the fact that resources are scarce, he adopts a technique which is the cheapest. The decision as to how goods should be produced depends on the price of the factors. Because of this, in a country like India labour intensive technique is adopted and in a country like Japan capital intensive technique is adopted.
Question.7. Explain the meaning of substitute and complementary goods with the help of suitable examples.
Answer. Substitute goods are those which can be used in place of one another to satisfy a given want. For example tea and coffee. On the other hand, complementary goods are a pair Of goods which cannot be used without one another. They are used together to satisfy a given want. For example pen and ink, car and petrol etc.
Question.8. Why is a firm under perfect competition a price taker and under monopolistic competition a price maker? Explain briefly.
Answer.Under perfect competition , a firm is a price taker meaning there by that it has to accept the price fixed by the forces demand and supply of the industry. No firm can deviate from this price because products are homogeneous. On the other hand, a firm is a price maker under monopolistic competition because products are clearly differentiated. Therefore if it raises price of its product , it does not lose the demand for its product.
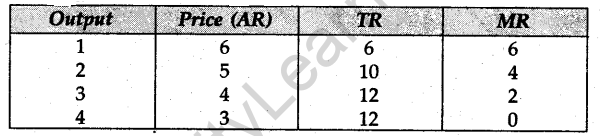
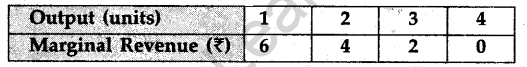
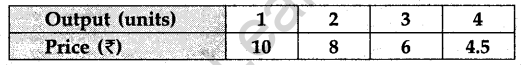
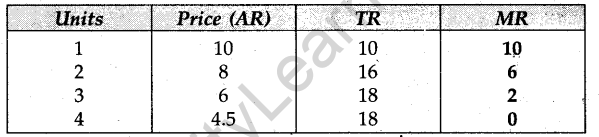
Question.9.From the following table calculate marginal revenue at each level of output:
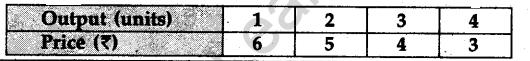
Answer.
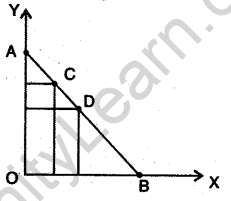
Question.10. What is a budget line? Why is it negatively sloped?
Answer. A budget line graphically represents various bundles of two commodities that can be bought by the consumer by spending his entire income given the prevailing prices. A budget line has a negative slope indicating that if a consumer buys more of one commodity, given his income and prices, he will be able to buy less of the other. This becomes clear from the given graph where AB is the budget line. Any bundle of two commodities lying on AB such as shown by point A, C, D or B is affordable given the income of the consumer and the prices of two commodities.
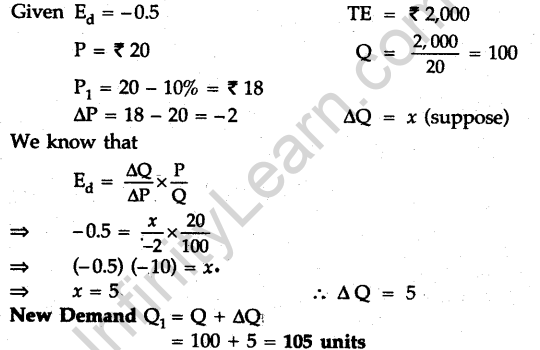
Question.11. The price elasticity of demand of a commodity is -03. At a price of Rs 20 per unit, total expenditure on it is Rs 2,000: Its price is reduced by 10 per cent. Calculate its demand at the reduced rate.
Answer.
Question.12. Explain the meaning and the conditions of producer’s equilibrium (under marginal revenue and marginal cost approach).
Answer. See Q. 14, 2011 (I Outside Delhi)
Or
Explain, giving reason, the effect of (i) rise in prices of inputs and (ii) rise in own price of the good, on the supply of a good.
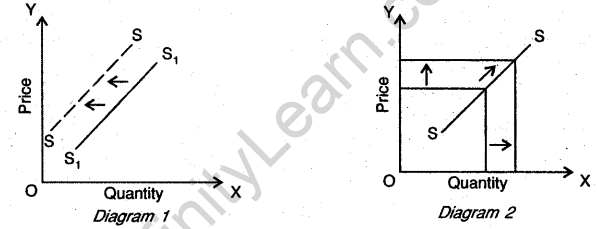
Answer. (i) An increase in prices of inputs will lead to a decrease in the supply of a commodity. Therefore supply curve shifts towards left, as shown in the diagram 1.
(ii) An increase in own price of the good will lead to a movement along the curve which is expansion of die supply. With the result there is an upward movement on the supply curve as shown in the diagram 2.
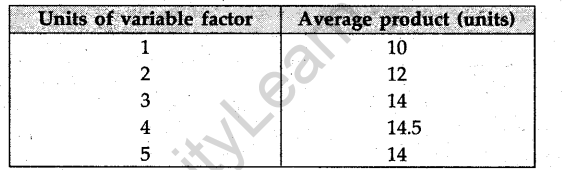
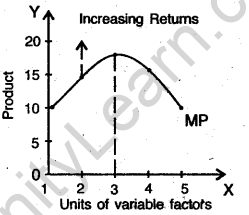
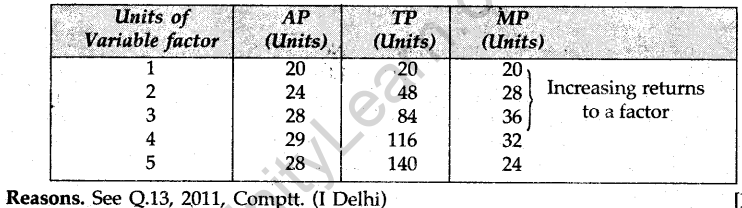
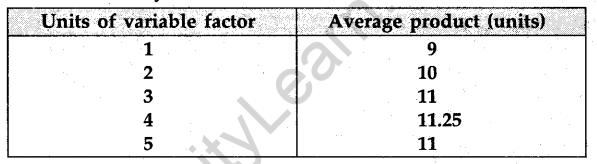
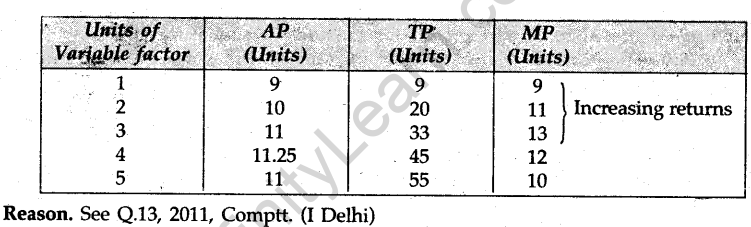
Question.13. From the following, table, find out the phase during which there are increasing returns to a factor. Give reasons for your answer.
Answer.
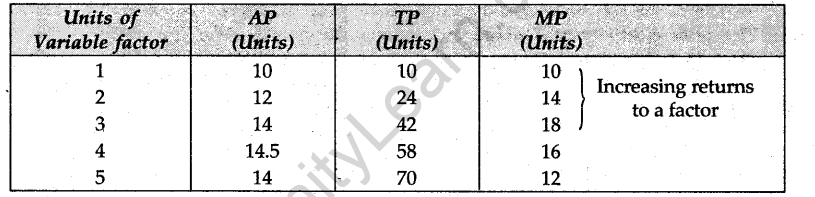
Units 1, 2, 3 (first phase) are governed by increasing returns to a factor because in this phase Marginal Product is increasing. This conclusion becomes evident looking at the diagram based on the above schedule.
Question.14. Explain the conditions of consumer’s equilibrium with the help of the indifference curve analysis. Represent the same in a diagram.
Answer. See Q.14, 2010 (I Delhi)
For blind candidates only in lieu of Q. No. 14.
Define indifference curve. Explain the conditions of consumer’s equilibrium with the help of the indifference curve analysis.
Answer. Indifference Curve: Ah indifference curve is a curve which represents all those combinations of two goods that give equal satisfaction to the consumer. See Q. 14, 2010 (I Delhi)
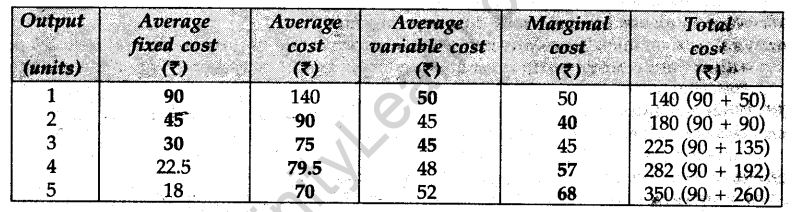
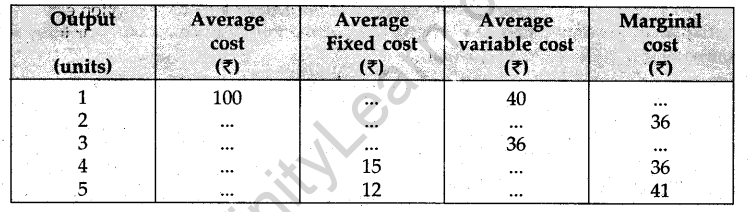
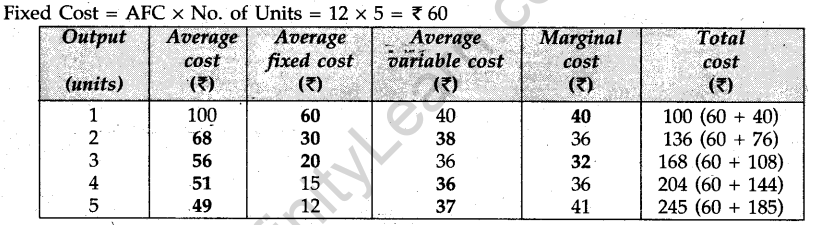
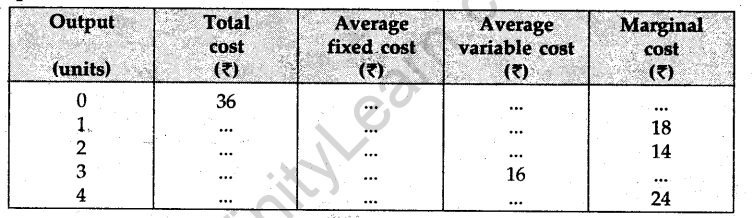
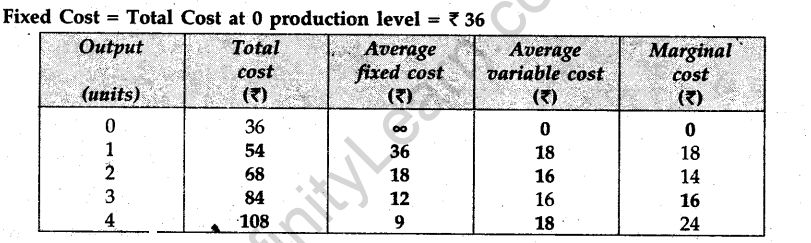
Question.15. Complete the following table:
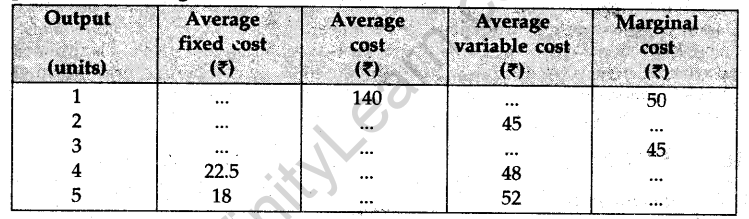
Answer. Fixed cost = AFC x No. of Units = 18 x 5 = Rs 90
Question.16. How will a fall in the price of tea affect the equilibrium price of coffee? Explain the chain of effects.
Answer. Tea and coffee are substitutes, therefore when the price of tea falls, it becomes cheaper in comparison to coffee. As such those consumers who drink coffee will start drinking tea. By implication, as a result of this, the demand for coffee will decline. As a result of decrease in a demand for coffee its price will fall.
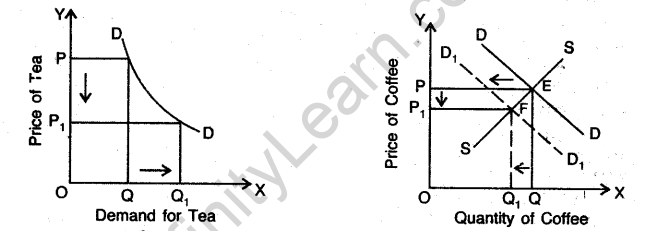
The entire process of the effect of fall in the price of tea on the equilibrium price of coffee can be explained with the help of the given diagram. As shown in the diagram, when price of tea falls from OP to OP 1, its demand increases. As, a result of this, there is a decrease in the demand for coffee. Therefore its demand curve shifts from DD to DD1. As a result of this, the equilibrium point which was E is now F, where the price is OP1 and. demand is OQ1.
Or
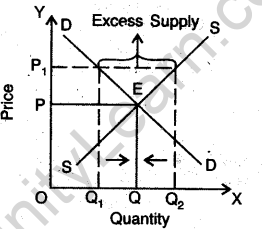
Explain the term market equilibrium. Explain the series of changes that will take place if market price is higher than the equilibrium price.
Answer. The equilibrium market price is determined at a point where supply and demand are equal. If market price is higher then the equilibrium rises, demand will fall and supply will increase, with the result that there will be excess supply. Therefore, for bringing equality in demand and supply, demand needs to be increased and supply decreased. This is possible only when market prise is brought to the level of equilibrium price.
The entire process can be explained with the help of a diagram. In the diagram, equilibrium price is OP. If the price increases to OPt (higher than the equilibrium price), demand will fall to OQ1 and supply will increase to OQ2. Therefore there will be excess of supply = Q1Q2. This position can be rectified by coming to equilibrium price, i.e. OP.
SECTION B
Question.17. Define capital formation.
Answer. Capital formation means creation of physical assets like buildings and machines for increasing the level of production in an accounting year.
Question.18. What is meant by real gross domestic product?
Answer. Real gross domestic product is the gross money value of final goods and services produced within the domestic territory in an accounting year. Gross money value is calculated using constant prices.
Question.19. What is bank rate?
Answer. Bank rate may be defined as the rate which a central bank charges from the commercial banks for giving them loans.
Question.20. State any two sources of non-tax revenue receipts.
Answer. Two sources of non-tax revenue receipts are: (i) fees and fines and (ii) commercial revenue.
Question.21. What is included in money supply?
Answer. Money supply includes currency and bank deposits.
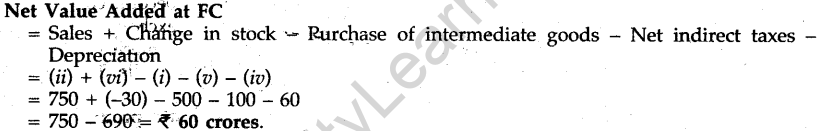
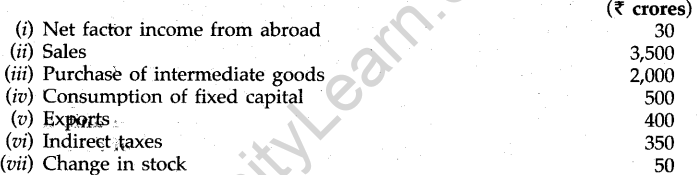
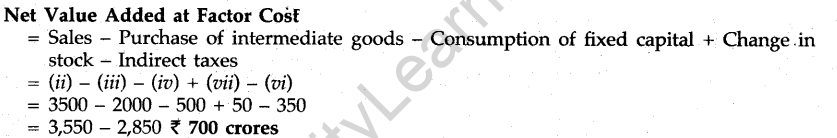
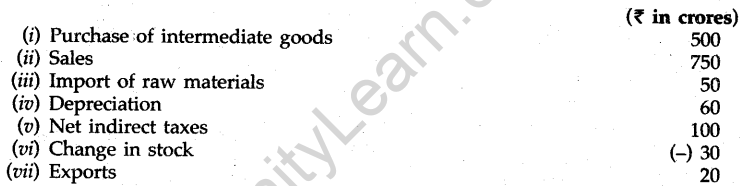
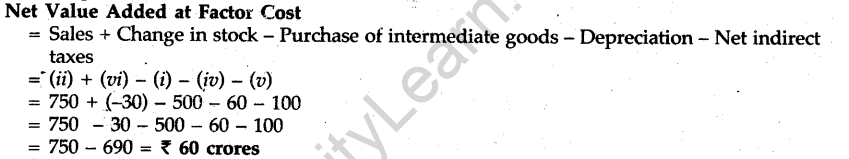
Question.22. From the following data, calculate “net value added at factor cost”:
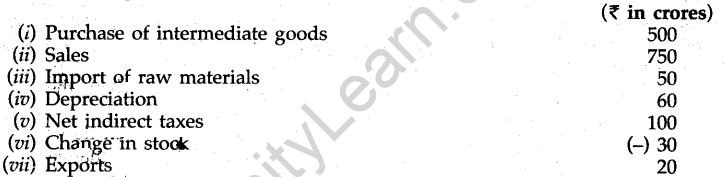
Answer.
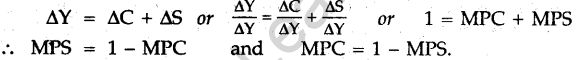
Question.23. Explain the meaning of marginal propensity to consume. What is its relationship with marginal propensity to save?
Answer. Marginal Propensity to Consume (MPC) may be defined as that proportion of income which is consumed. In other words, it is the ratio of change in consumption to change in income. Marginal Propensity to Save (MPS) is that part of income which is saved. In other words, it is equal to the ratio of change in saving tor change in income. The relationship between MPC becomes clear looking at the equations given below:
Question.24. State three objectives of a government budget.
Answer.
- Government allocates resources through budget keeping in view socio-economic objectives.
- Through a budget the government tries to affect the pattern of-distribution of income in the country. It lays emphasis on more equitable distribution of income and wealth to reduce inequalities. It tries to have a pattern where poor people stand-to gain.
- Through a budget government tries to bring about economic stability with a view to control the conditions of boom and depression.
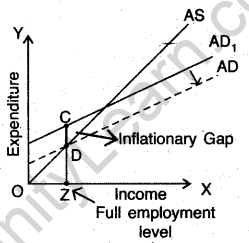
Question.25. In an economy aggregate demand is greater than aggregate supply.. Explain the changes that will take place in this economy.
Answer. If aggregate demand is greater than aggregate supply at the full employment level of output, this creates a problem of inflationary gap shown as (CD in the adjacent diagram). In such a situation necessary steps should be taken to reduce aggregate demand, for aggregate supply cannot be increased in the short run, so that aggregate supply becomes equal to aggregate demand. The position of excess aggregate demand at full employment level is shown in the diagram at point C. Now contractionary fiscal policy or contractionary monetary policy can be used to reduce AD and bring it down to point D to correct inflationary gap.
Or
Distinguish between voluntary unemployment and involuntary unemployment. What is the significance of this distinction?
Answer. Voluntary unemployment is that form of unemployment when unemployed persons are not willing to accept the job available at the given wage rate. On the other hand, involuntary unemployment refers to a situation when able bodied persons are willing to work but are not able to find jobs at the given wage rate. Such persons are unemployed against their choice. The distinction between voluntary and involuntary unemployment shows that either an economy is facing a problem of deflationary gap or inflationary gap. When there is involuntary unemployment, the output can be increased up to full employment level by simply boosting the demand in the economy. However, when there is voluntary unemployment, output cannot be increased.
Question.26. Explain why is there a fa|l in demand for foreign exchange when its price rises.
Answer. When the price of foreign exchange increases, more foreign exchange is required for importing the same volume of goods. This means imported goods become costlier. Therefore the demand of foreign goods will fall. Consequently, less foreign. exchange will be required or the demand for foreign exchange will fall. For example, when American dollar becomes costlier in terms of Indian rupee, the demand for American dollar falls. This increases the supply of foreign exchange in the market.
Question.27. How can externalities be a limitation of using gross domestic -product as an index of welfare?
Answer. Gross domestic product cannot always be regarded as an index of, welfare. There are many situations when only the GDP increases but not the economic welfare. One such condition is externalities. Externalities refer to the benefits or harms a firm or an individual causes to another for which they are not paid. For example, an oil refinery increases output of oil and, hence, increases GDP but, at the same time, it has a negative effect because it pollutes the water of the nearby water outlets and vitiates the atmosphere. As a result of which people living nearby are adversely affected. Thus externalities are a limitation for treating gross domestic product as an index of welfare.
Or
Giving reasons, categorise the following into stocks and flows:
(i) Losses (ii) Capital
(iii) Production (iv) Wealth
Answer. (i) Losses are flows : because they are related to a period of time.
(ii) Capital is a stock : measured at a point of time.
(iii) Production is a flow : because it is measured over a period of time.
(iv) Wealth is a stock : as it measured at a point of time.
Question.28. Define a government budget. Give meanings of revenue deficit, fiscal deficit and primary deficit.
Answer. Government Budget, Fiscal Deficit, Primary Deficit.
See Q. 29, 2010 Comptt. (I Outside Delhi)
Revenue Deficit. See Q. 29, 2010 Comptt. (I Delhi)
Question.29. Giving reasons state whether the following statements are true or false:
(i) Excess of foreign exchange receipts over foreign exchange payments on account of accommodating transactions equals deficit in the balance of payments.
(ii) Export and import of machines are recorded in capital account of the balance of payments account.
Answer. (i) The statement is false. Excess of outflow from autonomous transactions over inflow payments equals deficit in the balance of payments.
(ii) The statement is false. Export and import machines are recorded in current account of the BOP.
Question.30. How does a central bank influence credit creation by commercial banks through ‘open market operations’? Explain.
Answer. See Q. 25 (Or), 2008, (I Delhi)
Or
Explain the process of credit creation by commercial banks.
Answer. See Q. 31, 2011 (I Foreign)
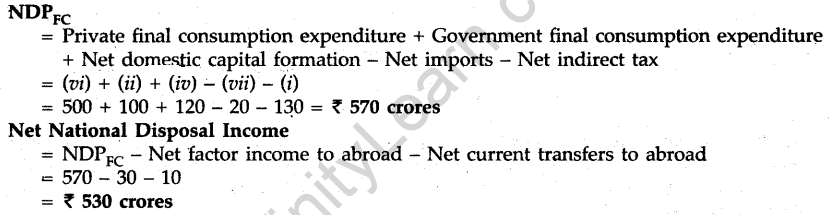
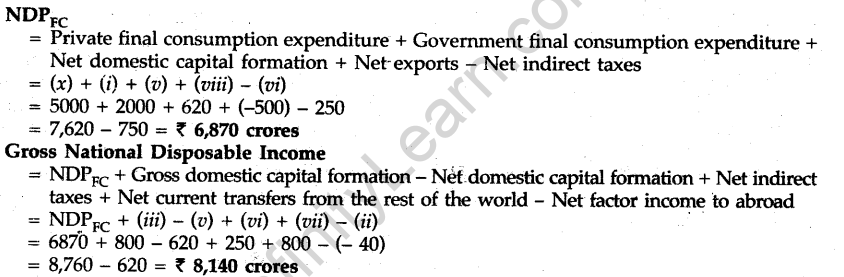
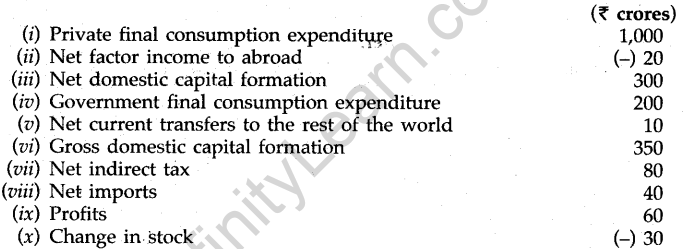
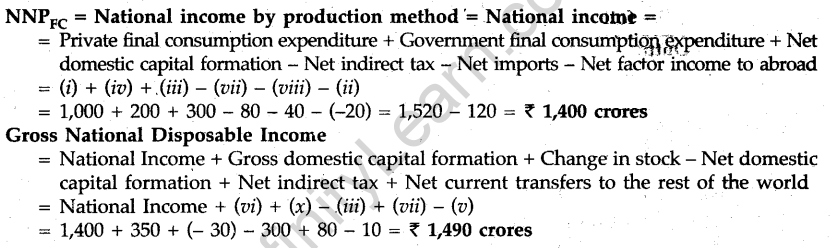
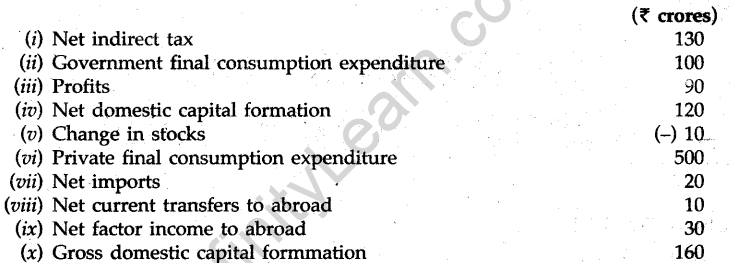
Question.31. Calculate (i) net domestic product at factor cost, and (ii) gross national disposable income from the following data:
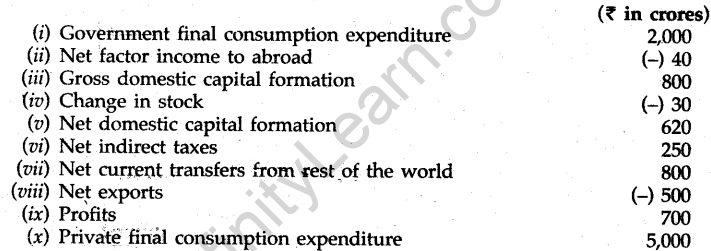
Answer.
Question.32. Explain the steps taken in derivation of the Saving curve from the Consumption curve. Use diagram.
Answer. See Q. 31, 2008 (I Outside Delhi)
For Blind candidates only in lieu of Q. No. 32.
Explain the steps taken in deriving the Saving function from the Consumption function.
Answer. See Q. 31, 2008 (I Outside Delhi)
SET II
Note : Except for the following questions, all the remaining questions have been asked in Set I.
SECTION A
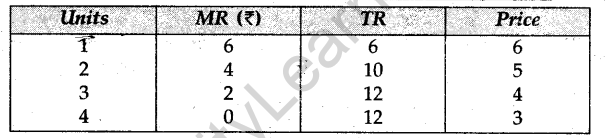
Question.9. From the following table calculate the price at each level of output:
Answer.
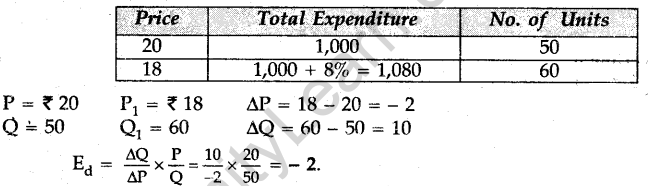
Question.11. The price of a commodity is Rs 20 per unit and total expenditure on it is Rs 1,000. When its price falls to Rs 18 per unit, total expenditure increases by 8 per cent. Calculate its price elasticity of demand by percentage method.
Answer.
Question.13. From the following table, find out the phase during which there are increasing returns to a factor. Give reasons for your answer.
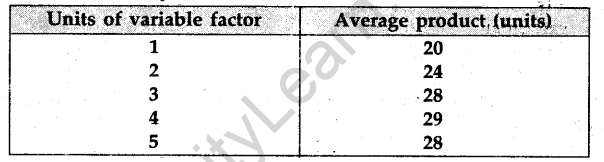
Answer.
Question.15. Complete the following table:
Answer.
SECTION B
Question.22. From the following data calculate “not value added at factor cost”.
Answer.
Question.30. Calculate (i) national income and (ii) gross national disposable income from the following data:
Answer.
SET III
Note: Except for the following questions, all the remaining questions have been asked in Set I and Set II.
SECTION A
Question.9. From the following table calculate marginal revenue at each level of output:
Answer.
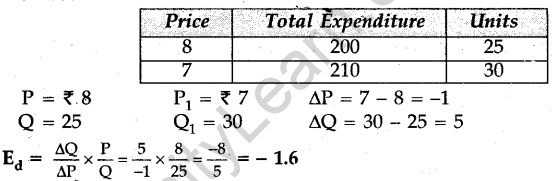
Question.11. When the price of a commodity falls from Rs 8 per unit to Rs 7 per unit, total expenditure on it increases from Rs 200 to Rs 210. Calculate its price elasticity of demand by percentage method.
Answer.
Question.13.From the following table, find out the phase during which there are increasing returns to a factor. Give reasons for your answer.
Answer.
Question.15. Complete the following table:
Answer.
SECTION B
Question.25. From the following data calculate “net value added at factor cost”.
Answer.
Question.30. Calculate (i) Gross domestic product at factor cost and (ii) Net national disposable income data:
Answer.