
Table of Contents
What is standard deviation
A statistical metric called the standard deviation assesses how much variance or dispersion there is in a set of data values. To comprehend the distribution of data points around the mean (average) value, it is frequently utilised.
Whether you are using a sample of the population, or the complete population will affect the formula for determining the standard deviation. Let’s begin by examining the sample standard deviation formula.
Use of Standard Deviation
- The degree of variance or dispersion in a group of data values is measured statistically using the standard deviation.
- The deviation between the data points and the mean (average) value is measured.
- To comprehend the range of data, people frequently utilise the standard deviation.
- The standard deviation formula has two variations: one for the full population and one for a sample.
- When you just have a portion of the data, you use the sample standard deviation (s), and when you have data on the full population, you use the population standard deviation ().
- Finding the mean, deducting it from each data point, squaring the differences, adding the squared differences, dividing by the proper denominator, and taking the square root of the outcome are the steps required to determine the standard deviation.
- The spread or dispersion of the data points is indicated by a bigger standard deviation, whereas the degree of variation in the data set is shown by a smaller standard deviation.
- When evaluating the variability of several data sets and drawing conclusions about the population from a sample, standard deviation is a valuable metric.


Standard deviation Formula
Sample standard deviation of formula:
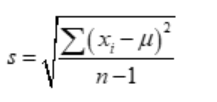
Standard deviation of ungrouped data:
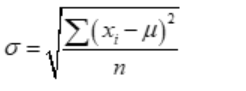
- xi represents ith observation.
- μ represents Mean
- n represents the number of observations.
- s represents Sample Standard deviation.
- σ represents Population standard deviation.
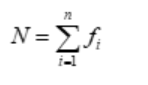
Standard deviation of Discrete frequency distribution
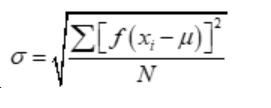
- xirepresents ith observation.
- μ represents Mean

n represents the number of observations. - σ represents Population standard deviation.
Steps for calculating the standard deviation of ungrouped data.
- Step1: Gather the data: Collect all of the individual data points for which the population standard deviation is to be calculated.
- Step 2: Determine the mean: Add all of the data points and divide the total number of data points. This will provide you the data set’s mean (average).
- Step 3: Calculate the deviations by subtracting the mean from each data point. These variations are known as deviations.
- Step 4: Square the deviations: In the previous step, square each deviation acquired. This is done to emphasise the contrasts while removing the negative indications.
- Step 5: Subtract the total of the squared deviations: Add all of the squared deviations from the previous step.
- Step 6: Divide by n: Divide the entire number of data points by the sum of squared deviations.
Steps for calculating the standard deviation of continuous frequency distribution.
- Step 1: Determine the midway for each class.
- Step 2: To get the product, multiply each midpoint by its associated frequency.
- Step 3: Add the items together.
- Step 4: Determine the mean by dividing the total frequency by the sum of the products.
- Step 5: Subtract the mean from each midpoint to calculate the deviation for each.
- Step 6: Square each difference.
- Step 7: Multiply each squared deviation by the frequency it corresponds to.
- Step 8: Add the squared and weighted deviations together.
- Step 9: Divide the overall frequency by the sum of the squared and weighted deviations.
- Step 10: Calculate the square root of the answer from Step 9.


Standard deviation examples.
Find the standard deviation of the data: 6, 7, 10, 12, 13, 4, 8, 12
Solution: The given data is 6, 7, 10, 12, 13, 4, 8, 12
Mean of the data is
μ = 6 + 7 + 10 + 12 + 13 + 4 + 8 + 12/8
= 72/8
= 9
Consider
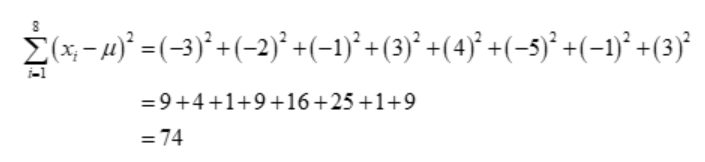
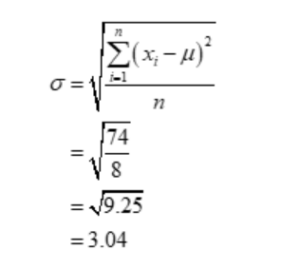
Therefore, the standard deviation of the given ungrouped data is
Find the standard deviation of the given continuous frequency data
| Class | 0-10 | 10-20 | 20-30 | 30-40 | 40-50 |
| Frequency | 5 | 8 | 15 | 16 | 6 |
Solution:
Consider the table below:
| Class | xi | fi | fixi | xi – μ | (xi – μ)2 | fi(xi – μ)2 |
| 0-10 | 5 | 5 | 25 | 22 | 284 | 2420 |
| 10-20 | 15 | 8 | 120 | 12 | 144 | 1152 |
| 20-30 | 25 | 15 | 375 | 2 | 4 | 60 |
| 30-40 | 35 | 16 | 560 | 8 | 16 | 1024 |
| 40-50 | 45 | 6 | 270 | 18 | 324 | 1944 |
| 50 | 1350 | 6600 |
Hence, the standard deviation is
It implies that
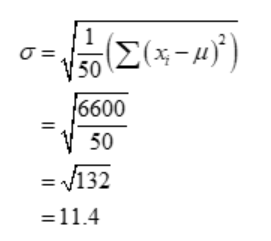
Therefore, the standard deviation is 28.04
FAQs on standard deviation
Where is standard deviation used?
The standard deviation is a statistical term that describes the degree of variation or dispersion in a group of data values. It is used in a variety of sectors. In descriptive statistics, it is used to characterise the dispersion of a data collection. It is used in finance to calculate the volatility of investments. It aids in hypothesis testing and estimating population parameters in inferential statistics. It measures process variability in quality control. It contributes to risk assessment by quantifying uncertainty. It analyses data variability and compares groups or situations in study. In general, the standard deviation is commonly used to explain and measure data set variability.
When standard deviation is 1
When the standard deviation is 1, the data points are quite near to the mean.
How do you calculate the standard deviation
Determine the data set's mean (average).
Subtract the mean from step 1 for each data point.
Each difference found in step 2 should be squared. Compute the sum of all squared differences.
Depending on whether you are using a sample of the population or the full population, divide the total from step 4 by the relevant denominator.
To get the standard deviation, square the figure you got in step 5's calculation.
What does the standard deviation tell you?
The standard deviation gives important details on the distribution or dispersion of data points in a data set. The standard deviation reveals the following:
Measure of variation
Spread data
Comparing Data sets
Probability distribution
Outliers Confidence intervals
In conclusion, the standard deviation is a measurement of how widely spaced-out data points are in relation to the mean. It gives you information on the spread, distribution, and variability of data, allowing you to comprehend the features of the data set and compare it to other data sets or draw inferences based on its variability.
Why do use the standard deviation
A quantitative indicator of the spread or dispersion of data points in a data collection is the standard deviation. Knowing how much a given data point deviates from the mean is useful. You may learn more about the variability of the data and the distribution of values by taking the standard deviation into account.
