Table of Contents
Introduction to Variance


Variance is a statistical term that quantifies a set of data points’ dispersion or variability around their mean. It gives useful information on the spread and distribution of data, making it a vital tool for data analysis and decision-making. In this post, we will look at what variance is, its formula, attributes, techniques for calculating it, solved instances, and answers to frequently asked problems..
Definition of Variance formula
Variance is a statistical concept that quantifies how far individual data points depart from a dataset’s mean. It provides information on the variability and spread of the data points, allowing us to comprehend the dispersion and distribution features.


Variance formula
A dataset’s variance can be estimated using the following formula:
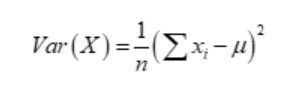
Where: Var(X) represents the dataset’s variance. The total number of data points in the dataset is X. n.
∑ represents the summation symbol. n is the number of data points
Each unique data point is represented by xi. μ is the mean of the data set
Properties of Variance
- Variance has various essential characteristics, including:
- Variance is always a positive number (Var(X) 0).
- If all of the data points are the same, the variance is zero (Var(X) = 0).
- The scale of the data influences variance. In the formula, squaring the differences emphasises the deviations and makes the variance scale-dependent.
- Because it lends more weight to extreme results, variance is less resistant to outliers.
How to calculate Variance
To compute the variance of a dataset, perform the following steps:
- Calculate the dataset’s mean (average).
- Square the result of subtracting the mean from each data point.
- Add all of the squared deviations together.
- Divide the total number of data points by the sum of squared deviations.


Points to remember in finding the variance
There are various things to keep in mind while calculating the variance:
- Ensure that the dataset is representative: The dataset should appropriately represent the population or phenomenon under consideration. Incorrect variance estimations might result from biassed or inadequate data.
- Calculate the mean precisely: The mean is an important component of the variance formula. Correctly calculate the mean by adding all of the data points and dividing by the total number of data points.
- To compute the variance, subtract each data point from the mean and then square the result. Squaring the deviations guarantees that they are positive and highlights the deviations from the mean
- Use the proper formula: The sum of squared deviations divided by the total number of data points is the variance formula. Use the correct formula to determine the variance based on your dataset and objectives.
- Consider the units: Variance is scale-dependent because it involves squaring the deviations. Keep in mind that the variance units will be the squared units of the original dataset. Consider using the standard deviation instead if you wish to interpret the variability in the original units.
- Outliers should be avoided: Variance is influenced by extreme values or outliers. Outliers can have a substantial impact on the variance computation since it lends greater weight to extreme results. If outliers are evident, consider analysing the robustness of the variance or considering alternate metrics.
- The variance should be interpreted correctly: Variance is a measure of variability or dispersion. Higher variance suggests greater data point dispersion around the mean, whereas lower variance indicates less variability. Interpret the variance in light of your study and the dataset’s features.
- Consider sample vs. population variance: Depending on your goal, you may need to compute variance for a sample or a population. Depending on whether you are working with a sample or the complete population, the calculation and adjustments may differ.
- By remembering these criteria, you may ensure that your variance calculations are accurate and useful, allowing you to successfully analyse the dispersion and variability of your data.
Problems on variance
Consider the following dataset: [4, 7, 9, 11, 12].
Step 1: Determine the mean: (4 + 7 + 9 + 11 + 12) / 5 = 8.6
Step 2: Find the squared deviations:
(4 – 8.6)² = 20.25
(7 – 8.6)² = 2.56
(9 – 8.6)² = 0.16
(11 – 8.6)² = 5.76
(12 – 8.6)² = 11.56
Step 3: Add the squared deviations together:
20.25 + 2.56 + 0.16 + 5.76 + 11.56 = 40.29
Step 4: Divide the total number of data points by the sum: 40.29 / 5 = 8.058
The dataset’s variance is around 8.058.
Frequently asked questions on Variance
What do you mean by variance ?
A statistical measure that assesses the dispersion or variability of a set of data points around their mean is known as variance. It gives useful information about how far apart the data points are from the average or central tendency.
What is variance and deviation
Variance is a measure of how far individual data points depart from a dataset's mean. The average squared difference between each data point and the mean is calculated. By squaring the differences, variance emphasises the spread of the data, giving more weight to larger deviations. It returns a numerical value that represents the dataset's average variability. Deviation: Deviation, specifically standard deviation, is a measure of data point dispersion or spread about the mean. The square root of the variance is used to compute it. Because it is in the same unit as the data, standard deviation is frequently favoured when analysing variability in the original units of the data.
Can variance be zero
Yes, zero variance is possible. Variance measures the spread or variability of a set of data points around their mean. When all of the data points in a dataset are the same, there is no variability or spread among them, resulting in a variance of zero.
Why use variance
Variance is an important statistical measure that is used for a variety of purposes. It quantifies data distribution, allowing us to comprehend unpredictability and make sound decisions. It helps with dataset comparison, risk assessment, model performance evaluation, analysing experimental results, finding outliers, and understanding distribution features. Variance offers useful insights for better data analysis and decision-making.
What are the properties of variance
Variance has numerous essential qualities as a statistical measure of dispersion or variability. Non-Negativity Zero Variance Linear Transformation Independence


