Table of Contents
Class 7 Science introduces students to various fascinating concepts of the world around them. Diagrams play a crucial role in understanding these concepts visually. Here are the top 10 must-know diagrams for Class 7 Science that will help students grasp complex topics with ease.
Class 7 Science
Class 7 Science is a foundational subject that introduces students to various scientific concepts and principles. It covers a wide range of topics, including biology, chemistry, physics, and environmental science. The CBSE curriculum aims to develop students’ understanding of the natural world and their scientific thinking skills. Class 7 Science often includes practical experiments and activities to help students apply theoretical knowledge in real-life situations.
Diagrams in Class 7 Science
In Class 7 Science, diagrams are used extensively to explain concepts related to biology, chemistry, physics, and environmental science. They are an essential tool for both teaching and learning, enabling students to explore and understand the wonders of the natural world. Diagrams in Class 7 Science serve as visual aids that enhance understanding and retention of concepts. They help students visualize complex structures and processes, making learning more engaging and effective.
Here are some key reasons why diagrams are important in Class 7 Science:
- Enhanced Understanding: Diagrams provide a visual representation of concepts, making them easier to understand and remember. They help students grasp abstract ideas and complex structures more effectively.
- Clarity and Simplification: Diagrams simplify complex information by breaking it down into visual components. This clarity helps students comprehend the subject matter more easily.
- Improved Retention: Visual aids, such as diagrams, enhance memory retention. Students are more likely to remember information presented in a visual format compared to text alone.
- Engagement: Diagrams make learning more engaging and interactive. They capture students’ attention and interest, leading to better understanding and retention of the content.
- Application of Knowledge: Diagrams help students apply their knowledge to real-life situations. They can visualize how scientific principles work in the natural world, fostering a deeper understanding of concepts.
- Facilitation of Communication: Diagrams facilitate communication of complex ideas between students, teachers, and researchers. They serve as a universal language that transcends barriers of language and culture.
Top 10 Must Know Diagrams for Class 7 Science
Here are the top 10 important Science diagram for class 7:
Water Cycle
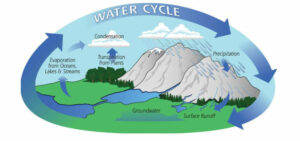
The water cycle diagram illustrates the continuous movement of water on, above, and below the surface of the Earth. It shows how water evaporates from oceans, lakes, and rivers due to the heat of the sun, forms clouds through condensation, falls back to the Earth as precipitation (rain or snow), and eventually flows back to the oceans, completing the cycle.
Respiratory System
The respiratory system diagram depicts the organs and structures involved in breathing and gas exchange. It includes the nose, trachea (windpipe), bronchi, lungs, and diaphragm. The diagram shows how air enters the body through the nose or mouth, travels down the trachea into the lungs, where oxygen is absorbed into the bloodstream, and carbon dioxide is expelled from the body.
Parts of a Flower
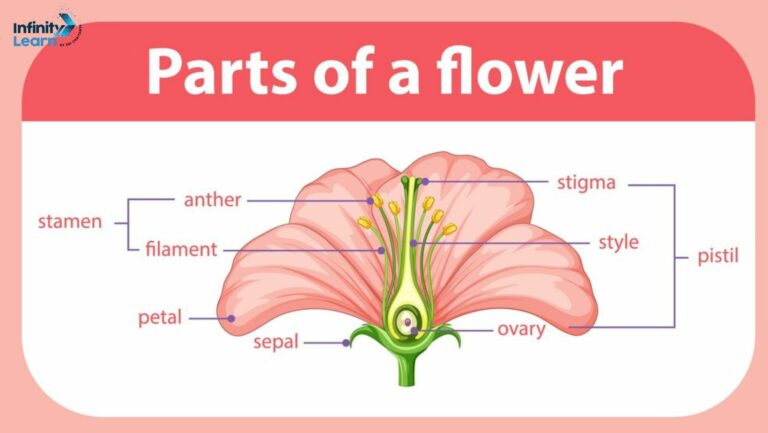
This diagram shows the different parts of a flower, including the petals, sepals, stamens (male reproductive organs), and pistil (female reproductive organ). It illustrates how these parts work together in the process of pollination and fertilization, leading to the formation of seeds and fruits.
Digestive System
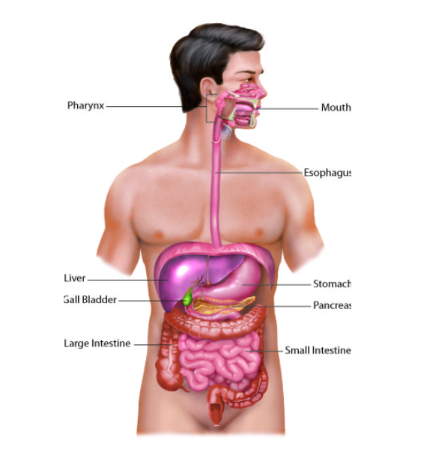
The digestive system diagram illustrates the organs involved in the digestion and absorption of food. It includes the mouth, esophagus, stomach, small intestine, large intestine, liver, and pancreas. The diagram shows how food is broken down into nutrients that can be absorbed into the bloodstream to nourish the body.
Solar System
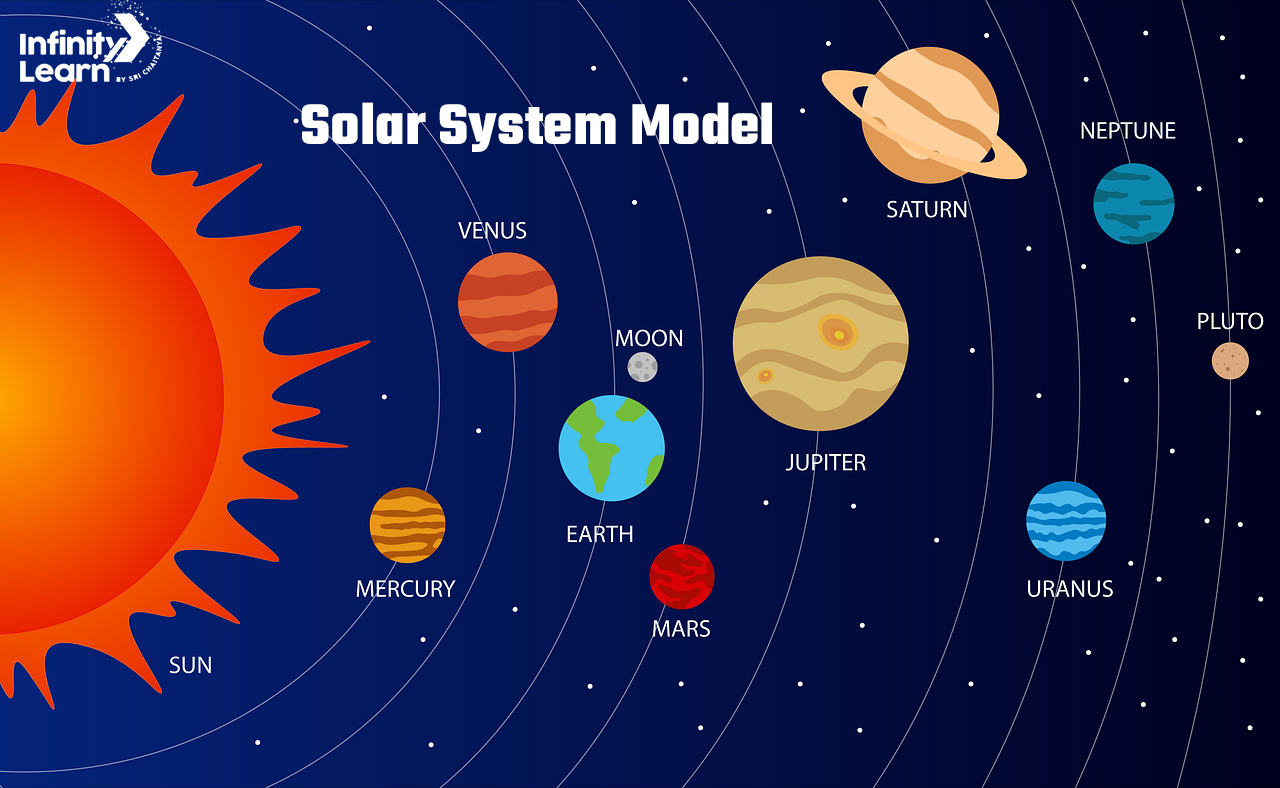
This solar system diagram shows the arrangement of planets in our solar system, including Mercury, Venus, Earth, Mars, Jupiter, Saturn, Uranus, and Neptune, orbiting around the sun. It illustrates the relative sizes and distances of the planets from the sun.
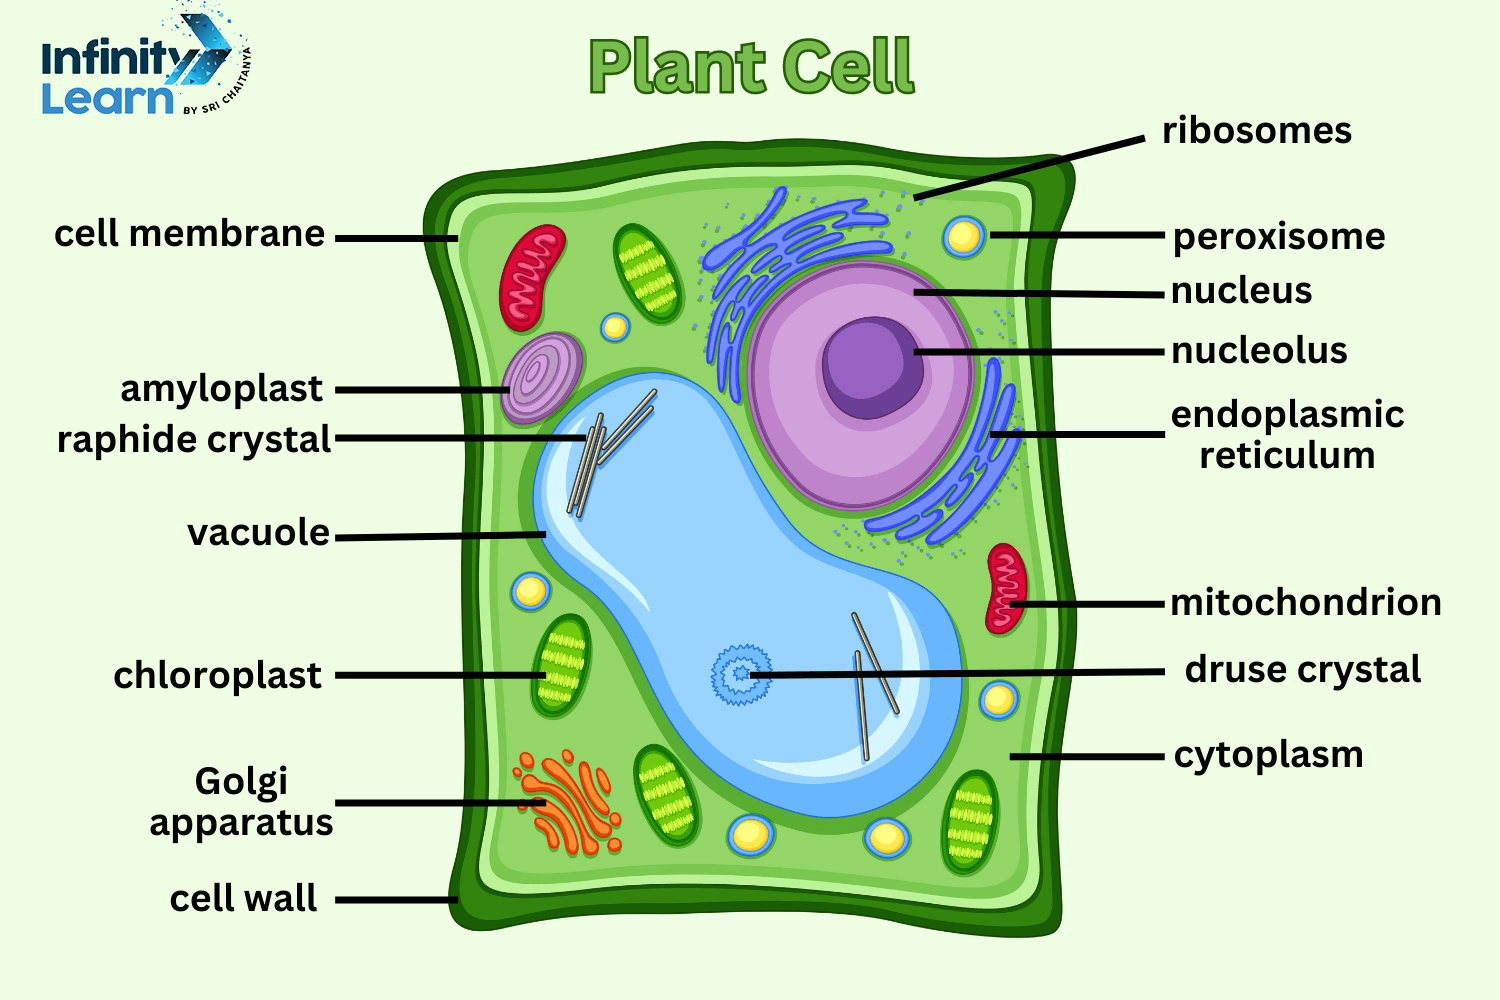
Plant Cell
The plant cell diagram illustrates the structures found in a typical plant cell, including the cell wall, cell membrane, nucleus, chloroplasts (where photosynthesis occurs), and vacuole (storage organelle). It shows how these structures work together to support the life and growth of the plant.
Animal Cell
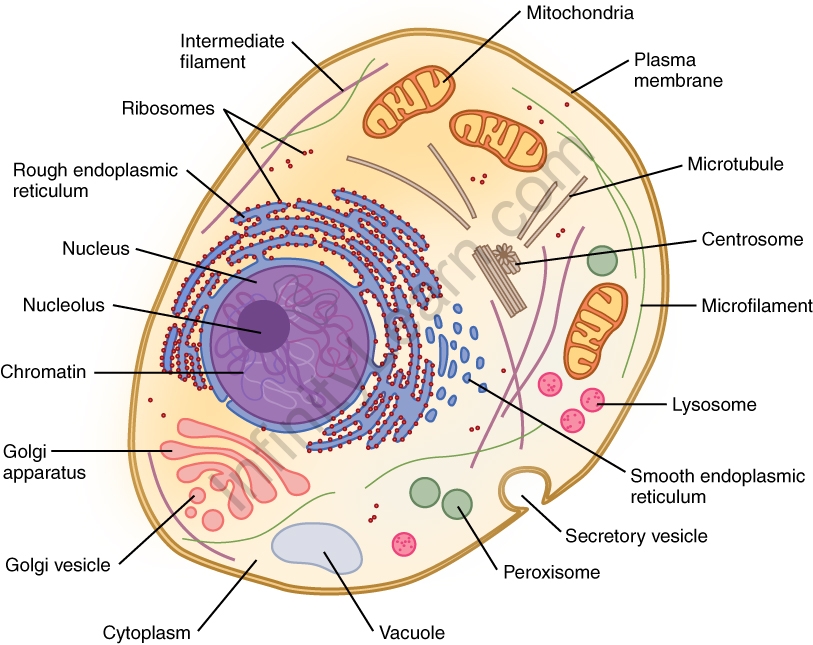
Similar to the plant cell diagram, the animal cell diagram shows the structures found in a typical animal cell, including the cell membrane, nucleus, mitochondria (where energy is produced), and endoplasmic reticulum (involved in protein synthesis). It illustrates the different organelles that perform specific functions within the cell.
Circulatory System
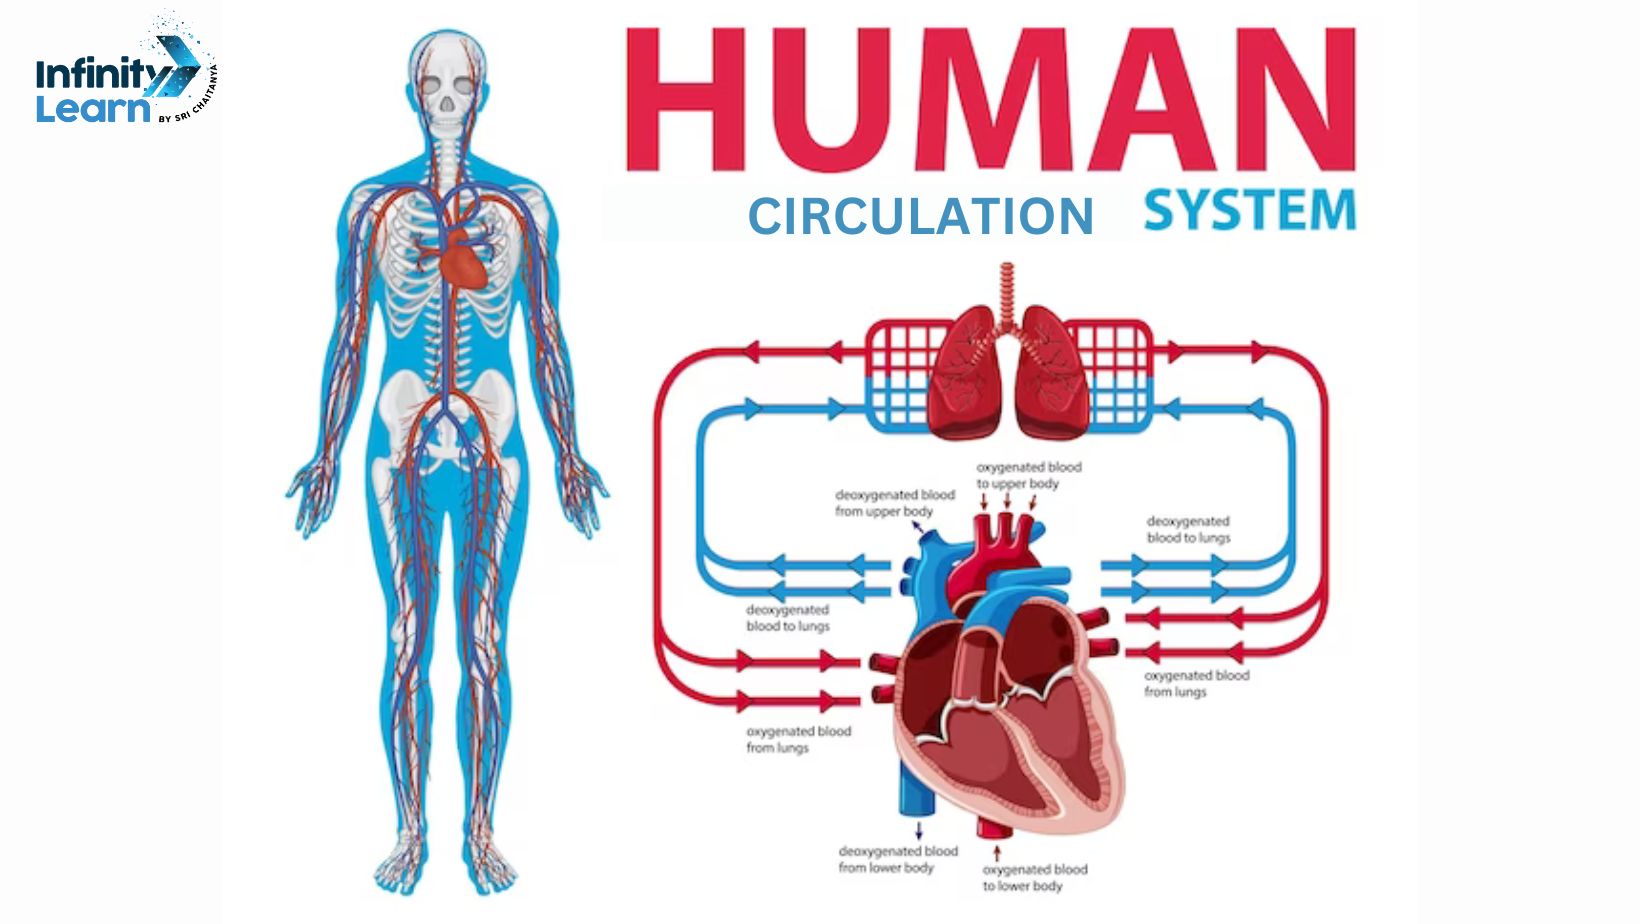
The circulatory system diagram illustrates the organs and structures involved in the circulation of blood throughout the body. It includes the heart, blood vessels (arteries, veins, and capillaries), and blood. The diagram shows how oxygenated blood is pumped from the heart to the body tissues and deoxygenated blood is returned to the heart.
Electric Circuit
The electric circuit diagram shows the components of a simple electric circuit, including a battery (power source), wires (conductors), switch (to control the flow of electricity), and bulb (to produce light). It illustrates how electricity flows from the battery through the circuit and back to the battery.
Food Chain
The food chain diagram illustrates the flow of energy in an ecosystem. It shows how energy is transferred from producers (plants) to primary consumers (herbivores), secondary consumers (carnivores), and so on. The diagram helps to understand the interdependence of organisms in a food chain and the concept of energy transfer in ecosystems.
Also Refer: Block Diagram of Computer
Conclusion
Diagrams are valuable tools in Class 7 Science that help students visualize and understand complex concepts. By familiarizing themselves with these top 10 must-know diagrams, students can enhance their learning experience and develop a deeper understanding of the natural world around them.
| Other Resources for Class 7 | |
| NCERT Exemplar Solutions Class 7 | NCERT Books for Class 7 |
| Class 7 Worksheets | NCERT Solutions for Class 7 |


