Using a Simple Pendulum, Plot its L-T2 Graph and Use it to Find the Effective Length of Seconds Pendulum.
Aim
Using a simple pendulum, plot its L-T2 graph and use it to find the effective length of second’s pendulum.
Apparatus
A clamp with stand, a split cork, thread, bob, vernier callipers, stop clock/watch, metre scale and a piece of chalk.
Theory
1. Simple Pendulum. An ideal simple pendulum consists of a heavy point mass (called bob) tied to one end of a perfectly in extensible, flexible and weightless string. There is no ideal simple pendulum. In practice, we make a simple pendulum by tying a metallic spherical bob to a fine cotton stitching thread.
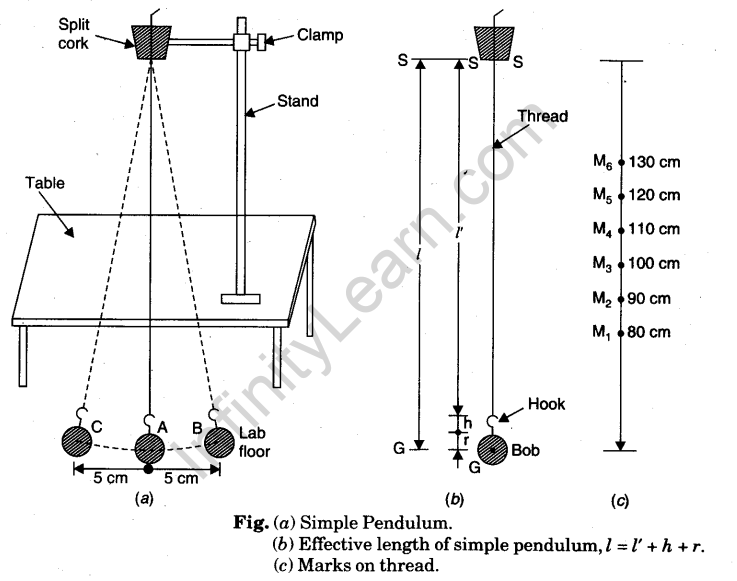
2. Length of Simple Pendulum. The distance between the point of suspension of ,the pendulum and its C.G. (which is C.G. of the bob), is called the length of the simple pendulum. It is represented by the symbol l.
Length of simple pendulum = length of thread + length of hook of bob + mean radius of the spherical bob
i.e., I = T + h + r
3. Time Period of the Simple Pendulum. Time taken by the bob of the simple pendulum to make one complete vibration, is called the time period of the simple pendulum. It
is represented by the symbol T. The time period is given by the formula,

Knowing the value of T and g, l can be calculated.
Diagram

Procedure
- Find the vernier constant and zero error of the vernier callipers and record it (as in Experiment 1).
- Determine the mean diameter of the spherical bob (as in Experiment 1A). Find the mean radius (r) of the bob.
- Find the length h of the hook attached to the bob by metre scale and record it.
- Take a cotton thread about 2 metres long and tie its one end with the hook.
- Put ink marks, M1, M2, M3, on the thread as distance of 80 cm, 90 cm, 100 cm, 110 cm, 120 cm, 130 cm, from the centre of gravity of the bob. These distances give effective length (l) of the simple pendulum.
- Pass the thread through the two split parts of a cork with the thread coming out just from 80 cm mark.
- Tight the two half cork pieces between the clamp.
- Fix the clamp in a stand kept on a table at such a height that the bob is just 2 cm above the laboratory floor.
- Mark a point A on the floor just below the position of bob at rest (mean position).
- Draw a straight line CAB, 10 cm long in direction along which bob will move when oscillating. A is middle point of CB.
- Find the least count and the zero error of the stop clock/watch. Bring its hands at zero position.
- Move the bob by hand to over position B on the right of A and leave. See that the bob returns over line BC without spinning.
- When the bob returns from C to A and starts moving to right of A, start the stop clock/ watch and count zero.
- The bob goes towards B to right extreme, returns from right extreme and goes to-wards C to left extreme. When bob crosses A from towards C, count one.
- In this way count up to 19. Become alert when bob starts the 20th vibration.
- Just when 20th vibration is completed, count 20 and at once stop the stop clock/watch.
- Find total time noting positions of both the hands of the clock/watch. This time is time for twenty vibrations.
- Repeat steps 13 to 18 two times more for same length.
- Move the clamp up by 10 cm.
- Loose the cork pieces and pull the thread out to increase its length by 10 cm. Now effective length of pendulum becomes 90 cm. Bob will be again 2 cm above the laboratory floor.
- Repeat steps 13 to 19 two times to take in all the two observations for this new length. Repeat step 20.
- Repeat step 21 and then steps 13 to 19 to take two observations each for lengths 90 cm, 100 cm, 110 cm, 120 cm and 130 cm.
- Record all the observations as given ahead.
Observations
1. Vernier constant of vernier callipers (V.C.) = ……..cm.
Zero error of vernier callipers (e) :
(i)………cm, (ii)……..cm, (iii)……….cm.
Mean zero error, (e) = ……….cm
Mean zero correction (c) = – e =………..cm
Observed diameter of the bob :
(i)………cm, (ii)………cm, (iii)………..cm.
Mean observed diameter, d0 =…..cm
Mean corrected diameter, d=d0+c=……….cm
Mean radius of the bob, r=d/2=………….cm
Length of hook of the bob, h=……….cm
Standard value of g- 980 cm s-2.
2. Least count of stop clock/watch = ……………s
Zero error of stop clock/watch = ………s
Zero correction of stop clock/watch = ……………s.
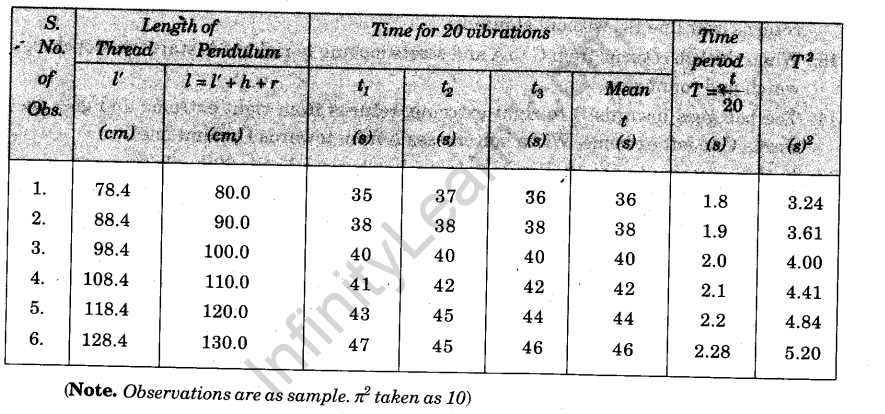
3. Table for Length (l) and time (T)

Calculations
(a) With the table
For each length, write mean time for 20 vibrations

Write mean values of t in column (3) of above table.
For each length, find time period T =t/20 s and write its value in column 4 and write value of T2 in column 5 of the above table.
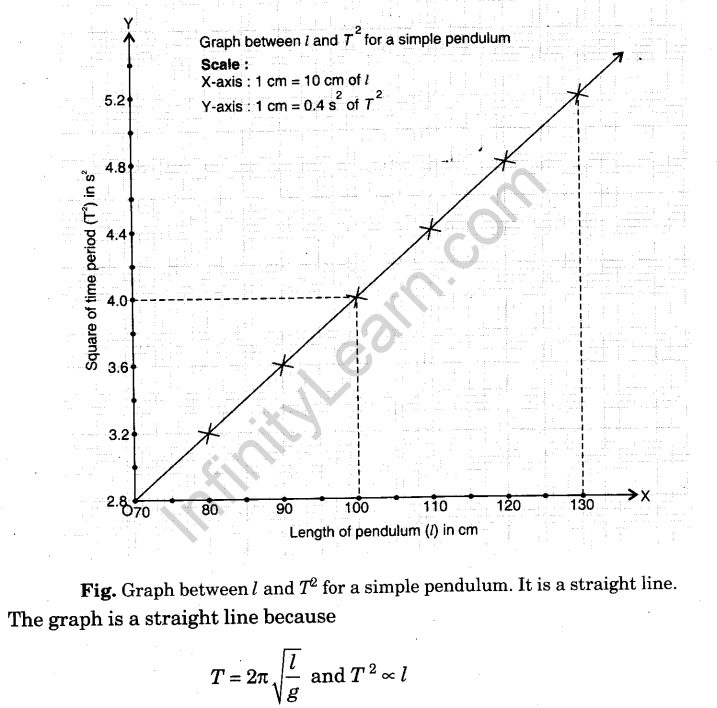
l-T2 graph. Plot a graph between l (column, 2b) and T2 (column 5) by taking Z along X- axis and T2 along Y-axis. The graph comes to be a straight line.
Graph

From this graph, for T2 = 4, l comes to be 100 cm.
Hence for seconds pendulum (T = 2 s) length comes to be 100 cm.
Result
Experimental length 100 cm Actual length = 99.4 cm Error = 0.6 cm
Percentage error = 0.6/99.4 x 100 = 0.6%
This error is within the limit of the experimental error.
Precautions
- Thread should be strong, weightless and in extensible.
- Point of suspension should be fixed in a rigid support.
- Lower faces of split cork should be in same level.
- Splitting should be perpendicular to the plane of vibration of the pendulum.
- Amplitude should be small to have sin 0 = 0. [when 0 < 18°]
- The bob should move along a straight line.
- The bob should not spin during vibration.
- Place of experiment should be free from disturbances of building vibrations or air current.
- Laboratory fan should be switched off.
- Length of pendulum should include length of hook and radius of bob.
- Counting should be proper and started from zero.
- Clock/watch should be accurate.
- Length of pendulum should be increased in steps of 10 cm to bring appreciable change in time period.
- Metre scale used should be accurate.
Sources of error
- The string may not be weightless and in extensible.
- Point of suspension may not be rigid.
- The amplitude may not be small.
- The bob may spin.
- The air currents may disturb vibrations.
- There may be an error in counting.
- The stop clock/watch may be inaccurate.
- There may be delay in starting and stopping the stop clock/watch.


