
Statistics for Economics Class 11 Notes Chapter 7 Correlation


Correlation
It is a statistical method or a statistical technique that measures quantitative relationship between different variables, like between price and demand.
According to Croxton and Cowden, “When the relationship is of a quantitative nature, the appropriate statistical tool for discovering and measuring the relationship and expressing it in a brief formula is known as correlation.”
Types of Correlation
Correlation is commonly classified into negative and positive correlation.
- Positive Correlation When two variables move in the same direction, such a relation is called positive correlation, e.g., Relationship between price and supply
- Negative Correlation When two variables changes in different directions, it is called negative correlation. Relationship between price and demand.
Degree of Correlation
Degree of correlation refers to the coefficient of correlation
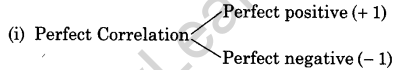
(ii) Absence of Correlation
(iii) Limited Degree of correlation
The degree of correlation between 0 and 1 may be rated as
- High (0.75 and 1)
- Moderate (0.25 and 0.75)
- Low (0 and 0.25)
Methods of Estimating Correlation
(i) Scatter Diagram Scattered diagram offers a graphic expression of the direction and degree of correlation.

Karl Pearson’s Coefficient of Correlation
This is also known as product moment correlation and simple correlation coefficient.
Karl Pearson has given a quantitative method of calculating correlation Karl Pearson’s coefficient correlation is generally written as V.
Formula According to Karl Pearson’s method, the coefficient of correlation is measured as
\(r=\frac{\Sigma x y}{N \sigma_{x} \sigma_{y}}\)
Where,
r = Coefficient of correlation;
x = x – \(\overline{x}\)
y= y – \(\overline{y}\)
σx = Standard deviation of x series
σy = Standard deviation of y series
N= Number of observations
If there is no need to calculate standard deviation of x and y directly using the following formula
\(r=\frac{\Sigma x y}{\sqrt{\Sigma x^{2} \times \Sigma y^{2}}}\)
Here, x(x – \(\overline{x}\)), y = (y – \(\overline{y}\))
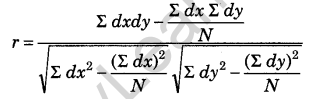
Short-cut Method
This method is used when mean value is not in whole number but in fractions. In this method, deviation is calculated by taking the assumed mean both the series.
Coefficient of correlation is calculated using the following formula

Here, dx = deviation of x series from the assumed mean = (x – A)
dy = deviation of y series from the assumed mean = (y – A)
Σ dxdy – sum of the multiple of dx and dy
Σ dx2 = sum of square of dx
Σ dy2 = sum of square of dy
Σdx= sum of deviation of x-series
Σdy = sum of deviation of y-series
N = Total number of items
Step Deviation Method
Coefficient of correlation is calculated using the following formula
Spearman’s Rank Correlation Coefficient
In 1904, ‘Charles Edwards Spearman’ developed a formula to calculate coefficient correlation of qualitative variables. It is popularly known as Spearman’s rank. Difference formula or method.

Coefficient of Rank Correlation when Ranks are Equal formula

Here, m = number of items of equal ranks.
Importance or Significance of Correlation
- The study of correlation shows the direction and degree of relationship between the variables.
- Correlation coefficient some times suggests cause and effect relationship.
- Correlation analysis facilitates business decisions because the trend path of one variable may suggest the expected changes in the other.
- Correlation analysis also helps policy formulation.


