Table of Contents
Class 11 Practical Work in Geography Chapter 8 NCERT Textbook Questions Solved
1. Choose the right answer from the four alternatives given below.
Question 1(i).
Which department prepares the weather map of India for each day?
(a) The World Meteorological Organisation
(b) The Indian Meteorological Department
(c) The Survey of India
(d) None of these.
Answer:
(b) The Indian Meteorological Department
Question 1(ii).
Which two liquids are used in maximum and minimum thermometers?
(a) Mercury and water
(b) Water and alcohol
(c) Mercury and alcohol
(d) None of these.
Answer:
(c) Mercury and alcohol
Question 1(iii).
Lines connecting the places of equal pressure are called
(a) Isobars
(b) Isohyets
(c) Isotherms
(d) Isohels.
Answer:
(a) Isobars
Question 1(iv).
The primary tool for weather forecasting is
(a) Thermometer
(b) Barometer
(c) Maps
(d) Weather charts.
Answer:
(d) Weather charts
Question 1(v).
If there is more humidity in the air, the difference between the readings of a dry bulb and a wet bulb will be
(a) Less
(b) More
(c) Equal
(d) None of these.
Answer:
(a) Less.
2. Answer the following questions in about 30 words.
Question 2(i).
What are the basic elements of weather?
Answer:
The weather elements include temperature, pressure, wind, humidity and cloudiness.
Question 2(ii).
What is a weather chart?
Answer:
The data received from various weather observatories are in plenty and detailed. Therefore, they cannot be incorporated in one single chart unless the coding designed to give the economy of expression is used. These are called synoptic weather charts and the codes used are called meteorological symbols.
Question 2(iii).
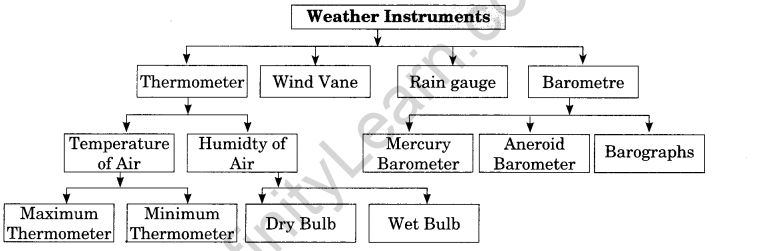
Which instruments are normally available in Class-I observatory to measure the weather phenomena?
Answer:
The highest category is Class-I. Typical instrumental facility available in a Class-I observatory consists of the following:
- Maximum and minimum thermometers
- Anemometer and wind vane
- Dry and Wet bulb thermometer
- Rain gauge
- Barometer
Observations are taken in these observatories normally at 00,03,06,09, 12,15,18,21 hours (Greenwich Mean Time) around the globe. However, for logistic reasons, some of the observatories take limited number of daily observations upper air observation during daytime only.
Question 2(iv).
What are Isotherms?
Answer:
These are lines connecting places of equal temperature.
Question 2(v).
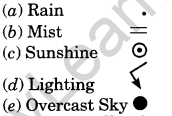
Which meteorological symbols are used to mark the following on a weather map?
(a) Rain
(b) Mist
(c) Sunshine
(d) Lightning
(e) Overcast Sky
Answer:
3. Answer the following question in not more than 125 words.
Discuss how weather maps and charts are prepared and how they are useful to us.
Answer:
Weather Maps: A weather map is the representation of weather phenomena of the earth or a part of it on a flat surface. It depicts conditions associated with different weather elements such as temperature, rainfall, sunshine and cloudiness, direction and velocity of winds, etc. on a particular day. These observations being taken at fixed hours are transmitted by code to the forecasting stations. The central office keeps a record of the observations, which forms
the basis for making a weather map. The upper air observations which are procured from hill stations, aeroplanes, pilot balloons, etc. are plotted separately.
Indian Meteorological Department is getting the weather maps and charts prepared regularly. Meteorological observatories transmit the data to the Central Observatory at Pune twice a day. Data is also collected on ships plying on the Indian seas. A good progress has been made in the field of weather forecasting and observation with the establishment of weather observatories in Antarctica, the International Indian Ocean Expedition, and the launching of rockets and weather satellites.
Utility:
- Weather maps help us to predict weather.
- Weather forecasting helps farmers, fishermen, soldiers, navigators and pilots in many ways.
- Disaster management is not possible without weather maps and charts. Weather Charts: The data received from various weather observatories are in plenty and detailed. As such, they cannot be incorporated in one single chart unless the coding designed to give the economy of expression is used. These are called synoptic weather charts and the codes used are called meteorological symbols.
- Utility:
- Weather charts provide the primary tools for weather forecasting.
- They help in locating and identifying different air masses, pressure systems, fronts and areas of precipitation.
Class 11 Practical Work in Geography Chapter 8 NCERT Extra Questions
Class 11 Practical Work in Geography Chapter 8 Multiple Choice Questions
Question 1.
Which of the following element of weather is measured through dry and wet thermometer?
(a) Temperature
(b) Humidity
(c) Pressure
(d) Wind Velocity.
Answer:
(b) Humidity
Question 2.
Weather charts are shown:
(a) Through Coding
(b) Through Information System
(c) Through Millibar
(d) Through Pressure Instruments.
Answer:
(a) Through coding
Question 3.
Which unit is used for measuring pressure?
(a) Centigrade
(b) Millibar
(c) Millimeter
(d) Centimeter.
Answer:
(b) Millibar
Question 4.
Weather charts do not help to recognize:
(a) Air masses
(b) Pressure systems
(c) Fronts
(d) Fog.
Answer:
(d) Fog
Question 5.
(a) What is the air pressure at sea level under normal condition?
(а) 500 gram per sq centimeter
(b) 800 gram per sq centimeter
(c) 1.03 kg per sq centimeter
(d) 2.06 kg per sq centimeter.
Answer:
(c) 1.03 kg per sq centimeter
Question 6.
Where are Central Observatory of India located?
(a) New Delhi
(b) Pune
(c) Kolkata
(d) Chennai.
Answer:
(b) Pune
Question 7.
These are lines connecting places of same mean’ daily duration of sunshine. What are these lines called?
(a) Isobars
(b) Isohyets
(c) Isotherms
(d) Isohels.
Answer:
(d) Isohels
Question 8.
What are lines connecting places of equal amount of rainfall over a given period of time called?
(a) Isobars
(b) Isohyets
(c) Isotherms
(d) Isohels.
Answer:
(b) Isohyets
Question 9.
What are the lines connecting places of same pressure called?
(a) Isobars
(b) Isohyets
(c) Isotherms
(d) Isohels.
Answer:
(a) Isobars
Question 10.
What are the lines connecting places of same mean value of cloud cover called?
(a) Isobars
(b) Isohyets
(c) Isonephs
(d) Isobits.
Answer:
(c) Isonephs.
Class 11 Practical Work in Geography Chapter 8 Very Short Answer Type Questions
Question 1.
Define the word weather.
Answer:
Weather denotes the atmospheric conditions of weather elements at a particular place and time.
Question 2.
What are basic elements of weather?
Answer:
The weather elements include temperature, pressure, wind, humidity and cloudiness.
Question 3.
How is relative humidity calculated?
Answer:
In simple words, we can say that relative humidity is expressed in ratio or percentage of total moist absorbing capacity of air.
It is calculated by using following formula:

For example, if humidity at a place is 5 gm while it has the capacity of absorbing 10 gm humidity at that temperature. Then we can say that relative humidity is 50%.
Question 4.
What are weather maps?
Answer:
A weather map is the representation of weather phenomena of the earth or a part of it on a flat surface. It depicts conditions associated with different weather elements such as temperature, rainfall, sunshine and cloudiness, direction and velocity of winds, etc. on a particular day.
Question 5.
What is the utility of weather charts?
Answer:
Weather charts provide the primary tools for weather forecasting. They help in locating and identifying different air ‘ masses, pressure systems, fronts and areas of precipitation.
Question 6.
When and why was first weather map drawn?
Answer:
First of all need for weather map was felt by boatmen. N 1688, Edmond Halley drew first weather map for 30° North and 30° South latitude.
Question 7.
What are three levels for recording meteorological observations worldwide?
Answer:
Globally, meteorological observations are recorded at three levels, viz. surface observatories, upper air observatories and space-based observation platforms. The World Meteorological Organization (WMO), a specialised agency of the United Nations, coordinates these observations.
Question 8.
What is aneroid barometer?
Answer:
Aneroid barometer gets its name from the Greek word, aneros in which ‘a’ means ‘not’, nero’s means moisture, hence aneroid means without liquid. It is a compact and portable instrument. It consists of a corrugated metal box made up of a thin alloy, sealed completely and made airtight after partial exhaustion of air.
Question 9.
Explain about rain gauge.
Answer:
The amount of rainfall is measured with the help of a rain gauge. The rain gauge consists of a metal cylinder on which a circular funnel is fitted. The diameter of the funnel’s rim is normally 20 cm. The rain drops are collected and measured in a measuring glass. Normally, rainfall is measured in the units of millimetres or centimetres. Snow is also measured in a similar manner by turning it into liquid form.
Question 10.
On what elements of weather does INS AT provide observations?
Answer:
The Indian National Satellite (INSAT) provides valuable observations of temperature, cloud cover, wind and associated weather phenomena.
Class 11 Practical Work in Geography Chapter 8 Short Answer Type Questions
Question 1.
How is weather forecasting useful for different groups?
Answer:
Weather forecasting is very important for all groups:
- Weather forecasts help in taking safety measures in advance in case of the likelihood of bad weather.
- It reduces the likely loss from natural calamities. Had tsunami been predicted in advance, the loss that happened could be minimized to a great extent.
- Predicting weather a few days in advance may prove very useful to farmers and to the crew of ships, pilots, fishermen, defence personnel, etc.
Question 2.
Explain in short about Wind Vane.
Answer:
Purpose: Wind vane is a device used to measure the direction of the wind. Structure: The wind vane is a light-weight revolving plate with an arrowhead on one end and two metal plates attached to the other end at the same angle. This revolving plate is mounted on a rod in such a manner that it is free to rotate on a horizontal plane. It responds even to a slight blow of wind.
Important Aspect: The arrow always points towards the direction from which the wind blows.
Question 3.
Explain in short about Anemometer.
Answer: An anemometer is an instrument that measures wind speed and wind pressure. Anemometers are important tools for meteorologists, who study weather patterns. They are also important to the work of physicists, who study the way air moves. The most common type of anemometer has three or four cups attached to horizontal arms. The arms are attached to a vertical rod. As the wind blows, the cups rotate, making the rod spin. The stronger the wind blows, the faster the rod spins. The anemometer counts the number of rotations, or turns, which is used to calculate wind speed. Because wind speeds are not consistent—there are gusts and lulls-wind speed is usually averaged over a short period of time.
A similar type of anemometer counts the revolutions made by windmill-style blades. The rod of windmill anemometers rotates horizontally. Other anemometers calculate wind speed in different ways. A hot-wire anemometer takes advantage of the fact that air cools a heated object when it flows over it.
Question 4.
How do Weather observatories work in India?
Answer:
Each day weather maps are prepared for that day by the Meteorological Department from the data obtained from observations made at various weather stations across the world. In India, weather-related information is collected and published under the auspices of the Indian Meteorological Department, New Delhi, which is also responsible for weather forecasting.
The Indian Meteorological Department (IMD) was established in 1875, with its headquarters at Calcutta. The IMD headquarters are presently located at New Delhi.
Question 5.
Write a short note on Stevenson Screen.
Answer:
The Stevenson screen is designed to protect thermometers from precipitation and direct sunlight while allowing air to circulate freely around them. Formation: It is made from wood with louvered sides to allow free and even flow of air. It is painted white to reflect radiation. It stands on four legs and is about 3 feet 6 inches above the level of the ground. The legs must be sufficiently rigid and be buried sufficiently in the ground to prevent shaking.
The front panel is hinged at the bottom to form a door, which allows for maintenance and reading of the thermometers. The door of Stevenson screen is always towards the north in the northern hemisphere and towards the south in the southern hemisphere because direct sun rays also affect mercury.
Objective: The purpose of the Stevenson screen is to create a uniform temperature enclosure that closely represents the same temperature as the air outside.
Question 6.
What is aneroid barometer? How does it work?
Answer:
Aneroid barometer gets its name from the Greek word, aneros in which ‘a’ means ‘not’, ‘neros’ means ‘moisture’, hence aneroid means without liquid. It is a compact and portable instrument. It consists of a corrugated metal box made up of a thin alloy, sealed completely and made airtight after partial exhaustion of air.
It has a thin flexible lid, which is sensitive to changes of pressure. As the pressure increases, the lid is pressed inward, and this, in turn, moves a system of levers connected to a pointer, which moves clockwise over the graduated dial and gives higher reading. When the pressure decreases, the lid is pushed outward and the pointer moves counter clockwise, indicating lower pressure. Barograph works on the principle of aneroid barometer.
There are a number of vacuum boxes placed one above the other so that the displacement is large. A system of levers magnifies this movement which is recorded by a pen on a paper attached to a rotating drum. The readings of a barograph are not always accurate, and therefore, they are standardised by comparing them with a mercury barometer reading.
Question 7.
Explain about surface observatory in detail.
Answer:
A typical surface observatory has instruments for measuring and recording weather elements like temperature (maximum and minimum), air pressure,humidity, clouds, wind and rainfall. Information: Specialised observatories record elements like radiation, ozone atmospheric trace gases, pollution and atmospheric electricity. These observations are taken all over the globe at fixed times of the day as decided by the WMO and the use of instruments are made conforming to international standards, thus making observations globally compatible.
Different types of surface observatories in India: In India, meteorological observations are normally classified into five categories depending upon their instruments and the number of daily observations taken. The highest category is Class-I. Typical instrumental facility available in a Class-I observatory consists of the following: Maximum and minimum thermometers, Anemometer, and wind vane, Dry and Wet bulb thermometer, Rain gauge and Barometer.
Question 8.
Differentiate between:
(i) Wet bulb and dry bulb,
Answer:
The dry bulb and wet bulb thermometers are two identical thermometers fixed to a wooden frame. But they are different in following way:
| Dry Bulb Thermometer | Wet Bulb Thermometer |
| It is used to measure lowest humidity | It is used to measure highest humidity. |
| The bulb of the dry bulb thermometer is kept uncovered and is exposed to the air | The bulb of the wet bulb thermometer is wrapped up with a piece of wet muslin, which is kept continuously moist by dipping a strand of it into a small vessel of distilled water. |
| Its temperature remains high. | The evaporation from the wet bulb lowers its temperature. |
(ii) Aneroid Barometer and Mercury Barometer.
Answer:
| Aneroid Barometer | Mercury Barometer |
| Aneroid barometer gets its name from the Greek word, aneros in which ‘a’ means ‘not’, ‘neros’ means ‘moisture’, hence aneroid means without liquid. It is a compact and portable instrument. | Mercury barometer is an accurate instrument and is used as a standard. In it the atmospheric pressure of any place is balanced against the weight of a column of mercury in an inverted glass tube. |
| It is filled with alcohol | It is filled with mercury |
| It is used to measure lowest temperature. | It is used to measure highest temperature. |
(iii) Centigrade and the Fahrenheit.
Answer:
Both are units of measuring temperature but they have some differences.
| Centigrade | Fahrenheit |
| On the Centigrade thermometer, the temperature of melting ice is marked 0°C and that of boiling water as 100°C, and the interval between the two is divided into 100 equal parts. | On the Fahrenheit thermometer, the freezing and boiling points of water are graduated as 32°F and 212°F respectively. |
| Centigrade = (Fahrenheit -32) | Fahrenheit= Centigrade ×\(\frac { 9 }{ 5 }\) +32 |
Class 11 Practical Work in Geography Chapter 8 Long Answer Type Questions
Question 1.
How is information about weather and related facts collected organized and dispensed in India?
Answer: In India, weather-related information is collected and published under the auspices of the Indian Meteorological Department, New Delhi, which is also responsible for weather forecasting.
A typical surface observatory has instruments for measuring and recording weather elements like temperature (maximum and minimum), air pressure, humidity, clouds, wind and rainfall. Specialised observatories also record elements like radiation, ozone atmospheric trace gases, pollution and atmospheric electricity. These observations are taken all over the globe at fixed times of the day as decided by the WMO and the use of instruments are made conforming to international standards, thus making observations globally compatible. In India, meteorological observations are normally classified into five categories depending upon their instruments and the number of daily observations taken. The highest category is Class-I.
Typical instrumental facility available in a Class-I observatory consists of the following:
- Maximum and minimum thermometers
- Anemometer and wind vane
- Dry and Wet bulb thermometer
- Rain gauge
- Barometer
Observations are taken in these observatories normally at 00,03,06,09, 12,15,18,21 hours (Greenwich Mean Time) around the globe. However, for logistic reasons, some of the observatories take limited number of daily observations upper air observation during daytime only.
Weather satellites make comprehensive and large-scale observations of different meteorological elements at the ground level as well in the upper layers of the atmosphere. The geo-stationary satellites provide space-based observations about weather conditions. The Indian National Satellite (INSAT) provides valuable observations of temperature, cloud cover, wind and associated weather phenomena.
Question 2.
Explain the working of a barometer.
Answer:
The instrument used to measure atmospheric pressure is called a barometer. The unit of measurement is in the millibar. The most commonly used barometers are the mercury barometer, aneroid barometer and barographs. All the three work differently. Their working is explained below briefly:
1. Mercury barometer: It is an accurate instrument and is used as a standard. In it the atmospheric pressure of any place is balanced against the weight of a column of mercury in an inverted glass tube.
2.Aneroid barometer: It is a compact and portable instrument. It consists of a corrugated metal box made up of a thin alloy, sealed completely and made airtight after partial exhaustion of air. It has a thin flexible lid, which is sensitive to changes of pressure. As the pressure increases, the lid is pressed inward, and this, in turn, moves a system of levers connected to a pointer, which moves clockwise over the graduated dial and gives higher reading. When the pressure decreases, the lid is pushed outward and the pointer moves counter clockwise, indicating lower pressure.
3. Barograph: It works on the principle of aneroid barometer. There are a number of vacuum boxes placed one above the other so that the displacement is large. A system of levers magnifies this movement which is recorded by a pen on a paper attached to a rotating drum. The readings of a barograph are not
always accurate, and therefore, they are standardised by comparing them with a mercury barometer reading.
Question 3.
Write short notes on the following:
(i) Safe place for a thermometer
(ii) Indian Daily Weather report
Answer:
(i) Safe place for thermometer: It is not safe to keep a thermometer in sunlight. We should also not keep it in airtight surroundings. The Stevenson screen is designed to protect thermometers from precipitation and direct sunlight while allowing air to circulate freely around them. It is made from wood with louvered sides to allow free and even flow of air. It is painted white to reflect radiation. The purpose of the Stevenson screen is to create a uniform temperature enclosure that closely represents the same temperature as the air outside.
It stands on four legs and is about 3 feet 6 inches above the level of the ground. The legs must be sufficiently rigid and be buried sufficiently in the ground to prevent shaking. The front panel is hinged at the bottom to form a door, which allows for maintenance and reading of the thermometers. The door of Stevenson screen is always towards the north in the northern hemisphere and towards the south in the southern hemisphere because direct sun rays also affect mercury.
(ii) Indian Daily Weather Report: IMD became a member of the World Meteorological Organization after independence on 27 April 1949. The agency has gained in prominence due to the significance of the monsoon rains on Indian agriculture. It plays a vital role in preparing the annual monsoon forecast, as well as in tracking the progress of the monsoon across India every season.
IMD undertakes observations, communications, forecasting and weather services. In collaboration with the Indian Space Research Organisation, the IMD also uses the IRS series and the Indian National Satellite System (INSAT) for weather monitoring of the Indian subcontinent. IMD was the first weather bureau of a developing country to develop and maintain its own satellite system. IMD is one of the 6 worldwide Regional Specialized Meteorological Centers of the Tropical Cyclone Programme of the World Weather Watch of the World Meteorological Organization. It is regional nodal agency for forecasting, naming and disseminating warnings about tropical cyclone in the Indian Ocean north of the Equator.
Question 4.
Explain the history of weather forecasting in India.
Answer:
In 1686, Edmond Halley published his treatise on the Indian summer monsoon, which he attributed to a seasonal reversal of winds due to the differential heating of the Asian land mass and the Indian Ocean. The first meteorological observatories were established in India by the British East India Company. These included the Calcutta Observatory in 1785, the Madras Observatory in 1796 and the Colaba Observatory in 1826. Several other observatories were established in India during the first half of the 19th century by various provincial governments.
After a tropical cyclone hit Calcutta in 1864, and the subsequent famines in 1866 and 1871 due to the failure of the monsoons, it was decided to organise the collection and analysis of meteorological observations under one roof.
As a result, the Indian Meteorology Department was established in 1875. Henry Francis Blanford was appointed the first Meteorological Reporter of the IMD. In May 1889,Sir John Eliot was appointed the first Director General of Observatories in the erstwhile capital, Calcutta. The IMD headquarters were later shifted to Shimla in 1905, then to Pune in 1928 and finally to New Delhi in 1944.
Question 5.
Explain the instruments used to measure atmospheric pressure.
Answer:
A barometer is a scientific instrument used in meteorology to measure atmospheric pressure. A simple barometer consists of a long glass tube (closed at one end, open at the other) filled with mercury and turned upside down into a container of mercury. The barometer works by balancing the mercury in the glass tube against the outside air pressure, just like a set of scales. As air pressure increases—that is, as the air becomes heavier—it pushes more of the mercury up into the tube. As air pressure decreases, more of the mercury drains from the tube. So the level of mercury in the tube provides a precise measure of air pressure.
Mercury barometer is . an accurate instrument and is used as a standard. In it the atmospheric pressure of any place is balanced against the weight of a column of mercury in an inverted glass tube. Aneroid barometer is a compact and portable instrument. It consists of a corrugated metal box made up of a thin alloy, sealed completely and made airtight after partial exhaustion of air. It has a thin flexible lid, which is sensitive to changes of pressure. As the pressure increases, the lid is pressed inward, and this, in turn, moves a system of levers connected to a pointer, which moves clockwise over the graduated dial and gives higher reading.
When the pressure decreases, the lid is pushed outward and the pointer moves counterclockwise, indicating lower pressure. Barograph works on the principle of aneroid barometer. There are a number of vacuum boxes placed one above the other so that the displacement is large. A system of levers magnifies this movement which is recorded by a pen on a paper attached to a rotating drum. The readings of a barograph are not always accurate, and therefore, they are standardised by comparing them with a mercury barometer reading.
Class 11 Practical Work in Geography Chapter 8 Viva Questions
Question 1.
When was IMD established?
Answer:
The Indian Meteorological Department (IMD) was established in 1875.
Question 2.
When was the headquarter of IMD established? Where is it located now?
Answer:
In 1875, it was established with its headquarters at Calcutta. The IMD headquarters are presently located at New Delhi.
Question 3.
What is the air pressure at sea level under normal condition?
Answer: At the sea level, under normal conditions, the pressure of air is 1.03 kg per square centimetre.
Question 4.
Name the instrument used to measure:
(a) Air temperature.
(b) Direction of the wind.
(c) Atmospheric pressure
(d) Amount of rainfall
Answer:
(a) Thermometer
(b) wind vane
(c) Barometer
(d) Rain Gauge
Question 5.
Name the lines connecting:
(a) Places of equal air pressure.
(b) Places of equal temperature
(c) Places of equal amount of rainfall
(d) Places having the same mean values of temperature, rainfall, pressure, sunshine, clouds, etc.
(e) Places of same mean daily duration of sunshine.
(f) Places of same mean value of cloud cover.
Answer:
(a) Isobar
(b) Isotherms
(c) Isohyets
(d) Isopleth
(e) Isohels
(f) Isonephs
Map Skills
Study Figures 1 and 2 and answers the following questions.
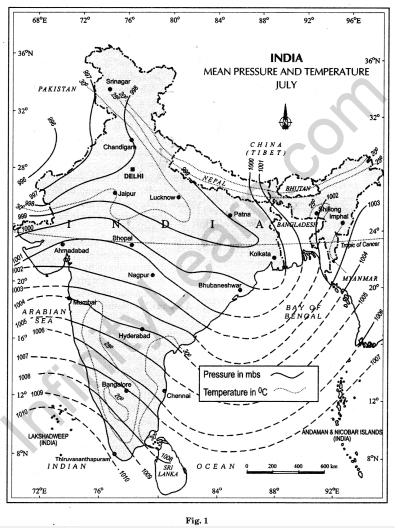
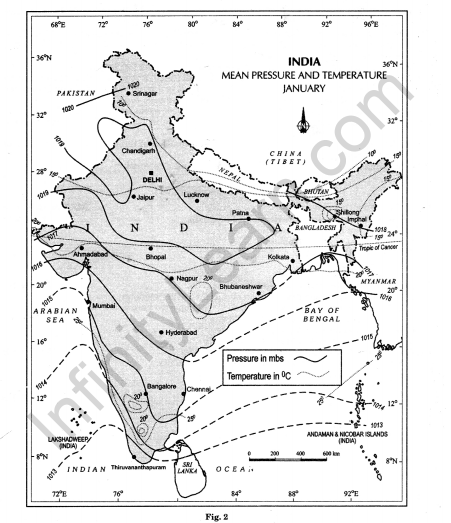
(a) Which seasons are shown in these maps?
Answer:
These maps are showing winter season and monsoon season.
(b) What is the value of the highest isobar in Figure 1 and through which part of the country does it pass?
Answer:
The value of highest isobar in figure 1 is 1010 millibar and it is passing through south¬west part of the country.
(c) What are the values of the highest and the lowest isobars in Figure 2 and where are they located?
Answer:
The value of highest isobar in figure 2 is 1020 millibar and lowest isobar is 1013 millibar. Highest values are located in Lakshadweep and coastal areas of Kerala and lowest is located in Pakistan.
(d) What are the patterns of temperature distribution in both the maps?
Answer:
In figure 1, the temperature of July in South India is 20° and temperature of North India is between 20° to 30°. In figure 2 the temperature of January in North India is between 10° to 15° and temperature of South India is between 20° to 25°.
(e) In which parts do you see the highest and the lowest mean temperature in Figure 1?
Answer:
In figure 1, we can see highest mean temperature in North India and lowest mean temperature in South India.
(f) What relationship do you see between the distribution of temperature and pressure in both the maps?
Answer:
As temperature increases, pressure decreases and vice
Weather Instruments, Maps and Charts Notes
- Weather denotes the atmospheric conditions of weather elements at a particular place and time. The weather elements include temperature, pressure, wind, humidity and cloudiness.
- Each day weather maps are prepared for that day by the Meteorological Department from the data obtained from observations made at various weather stations across the world.
- The Indian Meteorological Department (IMD) was established in 1875, with its headquarters at Calcutta. The IMD headquarters are presently located at New Delhi.
- Weather forecast helps us to take preventive action for bad weather in advance. Some time
ago weather forecasting was used at a large scale by farmers, fishers, boatmen, pilot, ship navigators, soldiers, etc.
The wind vane is a lightweight revolving plate with an arrowhead on one end and two metal plates attached to the other end at the same angle. This revolving plate is mounted on a rod in such a manner that it is free to rotate on a horizontal plane. It responds even to a slight blow of wind. The arrow always points towards the direction from which the wind blows.
The amount of rainfall is measured with the help of a rain gauge. The rain gauge consists of a metal cylinder on which a circular funnel is fitted. The diameter of the funnel’s rim is normally 20 cm. The rain drops are collected and measured in a measuring glass. Normally, rainfall is measured in the units of millimetres or centimetres. Snow is also measured in a similar manner by turning it into liquid form.
Thermometer is used to measure air temperature. Most thermometers are in the form of a narrow closed glass tube with an expanded bulb at one end. The bulb and the lower part of the tube are filled with liquid such as mercury or alcohol. Before the other end is sealed off, the air in the tube is released by heating it. The bulb of the thermometer in contact with the air gets heated or cooled, as the case may be, as a result of which the mercury in the bulb rises or falls. A scale is marked on the glass tube and readings are taken from there.
The two most common scales used in thermometers are Centigrade and the Fahrenheit. On the Centigrade thermometer, the temperature of melting ice is marked 0°C and that of boiling water as 100°C, and the interval between the two is divided into 100 equal parts. On the Fahrenheit thermometer, the freezing and boiling points of water are graduated as 32°F and 212°F respectively.
While the maximum thermometer and minimum thermometer are used to measure the air temperature, the dry bulb and the wet bulb thermometers are used to determine the humidity in the air. A set of these thermometers is kept in the Stevenson Screen.
The maximum thermometer is designed to record the highest temperature during a day. As the temperature increases, the mercury moves up into the tube; however, as the mercury cools, it cannot move downwards because of a constriction in the tube. It must be reset again to bring it down. The minimum thermometer records the lowest reading in a day. In this thermometer, alcohol is used in place of mercury. When the temperature decreases, the metal pin in the tube goes down and strikes at the minimum temperature.
The air around us has weight, and it exerts great pressure on the earth’s surface. At the sea level, under normal conditions, the pressure of air is 1.03 kg per square centimetre. Due to constant movement of air, change in temperature and variation in its vapour content, the weight of the air changes continuously with time and place. The instrument used to measure atmospheric pressure is called a barometer.
The most commonly used barometers are the mercury barometer, aneroid barometer and barographs. The unit of measurement is in the millibar.
Globally, meteorological observations are recorded at three levels, viz. surface observatories, upper air observatories and space-based observation platforms. The World Meteorological Organization (WMO), a specialised agency of the United Nations, coordinates these observations.
A typical surface observatory has instruments for measuring and recording weather elements like temperature (maximum and minimum), air pressure, humidity, clouds, wind and rainfall. Specialised observatories also record elements like radiation, ozone atmospheric trace gases, pollution and atmospheric electricity. These observations are taken all over the globe at fixed times of the day as decided by the WMO and the use of instruments are made conforming to international standards, thus making observations globally compatible.
Weather Instruments, Maps and Charts Important Terms
- Weather: The condition of the atmosphere at a given place and time with respect to atmospheric pressure, temperature, humidity, precipitation, cloudiness and wind is called weather.
- Weather Elements: Pressure, temperature, humidity, precipitation, cloudiness and wind are known as weather elements.
- Weather Forecast: It is weather prediction with a reasonable amount of certainty about the conditions of weather that would prevail in the coming 12 to 48 hours in a certain area.
- Thermometer: Thermometer is used to measure air temperature.
- Wind Vane: Wind vane is a device used to measure the direction of the wind.
- Barometer: The instrument used to measure atmospheric pressure is called a barometer.
- Rain Gauge: The amount of rainfall is measured with the help of a rain gauge.
- Weather Maps: A weather map is the representation of weather phenomena of the earth or a part of it on a flat surface. It depicts conditions associated with different weather elements such as temperature, rainfall, sunshine and cloudiness, direction and velocity of winds, etc. on a particular day.
- Weather Symbols: These are standard symbols used to convey messages received from all the observatories for plotting on the map. These are standardised by the World Meteorological Organisation and the National Weather Bureaus.
- Isopleth: Isopleth can be interpolated for places having the same mean values of temperature, rainfall, pressure, sunshine, clouds, etc.
- Isobars: These are lines connecting places of equal air pressure.
- Isotherms: These are lines connecting places of equal temperature.
- Isohyets: These are lines connecting places of equal amount of rainfall over a given period of time. ‘
- Isohels: These are lines connecting places of same mean daily duration of sunshine.
- Isonephs: Lines connecting places of same mean value of cloud cover.


