Table of Contents
Introduction to normal distribution


A key concept in statistics and probability theory is the normal distribution, commonly known as the Gaussian distribution. It is a frequent model for many natural phenomena because it displays a symmetric bell-shaped curve with data points uniformly dispersed around the mean. Understanding the normal distribution’s traits and characteristics is important in many sectors, including science, economics, and quality control.
Definition of normal distribution
A symmetric bell-shaped curve characterises the normal distribution, a continuous probability distribution. Its mean and standard deviation characterise it completely. Data points in a normal distribution cluster around the mean, with the majority falling within one standard deviation. Because of its occurrence in numerous real-world events, it serves as a critical model in statistical analysis, allowing researchers to draw useful conclusions and predictions.


Formula for normal distribution:
The normal distribution, denoted as N(μ, σ²), is characterized by two parameters: the mean (μ) and the variance (σ²) or standard deviation (σ). The probability density function (PDF) of the normal distribution is given by:
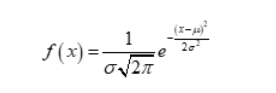
where:
x is the random variable.
μ is the mean, representing the center of the distribution.
σ² or σ is the variance or standard deviation, determining the spread of the data points around the mean.
π is the mathematical constant (approximately 3.14159).
e is the base of the natural logarithm (approximately 2.71828).
The normal distribution is symmetric, with the mean, median, and mode all equal, forming a bell-shaped curve. It is widely used in statistical inference, hypothesis testing, and modeling real-world phenomena due to its mathematical properties and prevalence in various natural processes.
Normal distribution curve
The normal distribution curve, also known as the Gaussian curve or bell curve, is a fundamental concept in statistics and probability theory. It represents the probability density function of a continuous random variable, following the normal distribution. The curve is symmetric, with data points clustered around the mean, and it is fully defined by its mean (μ) and standard deviation (σ). The curve is characterized by a bell-shaped appearance, with the highest point at the mean, and it extends infinitely in both directions along the x-axis. The area under the curve represents the probability of different events occurring, and specific regions have well-defined probabilities based on z-scores. The normal distribution curve plays a crucial role in various fields, including inferential statistics, quality control, finance, and scientific research, enabling researchers to make accurate predictions, identify outliers, and make informed decisions. Understanding the properties and applications of the normal distribution curve is essential for mastering statistical analysis and drawing meaningful conclusions from data.
Standard deviation of normal distribution
In a normal distribution, the standard deviation (σ) is a crucial parameter that measures the spread or dispersion of data points around the mean (μ). It quantifies the variability or how much individual data points deviate from the central value.
Key points about standard deviation in a normal distribution:
- Range of data: Roughly 68% of the data falls within one standard deviation from the mean (μ ± σ), about 95% within two standard deviations (μ ± 2σ), and almost 99.7% within three standard deviations (μ ± 3σ).
- Bell-shaped curve: In a normal distribution, the standard deviation determines the width of the curve. A larger standard deviation results in a wider, more spread-out curve, indicating more variability in the data.
- Precision: Smaller standard deviation indicates data points are closely clustered around the mean, representing higher precision and less variability.
- Measure of uncertainty: Standard deviation plays a crucial role in measuring the uncertainty associated with a set of data, making it an essential tool for hypothesis testing and confidence interval estimation.
- Comparing distributions: Researchers use standard deviation to compare distributions, determine statistical significance, and identify outliers.
- Understanding the standard deviation in a normal distribution allows statisticians and researchers to gain insights into data variability and make more informed decisions based on the properties of the distribution.


Solved examples on normal distribution
Example 1: Heights of Adult Males
Suppose the heights of adult males in a certain population follow a normal distribution with a mean height (μ) of 175 cm and a standard deviation (σ) of 6 cm. Calculate the probability that a randomly selected adult male has a height between 168 cm and 180 cm.
Solution:
We are given μ = 175 cm and σ = 6 cm.
To calculate the probability of a height between 168 cm and 180 cm, we need to find the area under the normal distribution curve within this range.
Using the Z-score formula:
Z = (x – μ) / σ
For x = 168 cm:
Z1 = (168 – 175) / 6 ≈ -1.17
For x = 180 cm:
Z2 = (180 – 175) / 6 ≈ 0.83
Using a Z-table or a statistical calculator, we find the area to the left of Z1 is approximately 0.1210, and the area to the left of Z2 is approximately 0.7967.
The probability of a randomly selected adult male having a height between 168 cm and 180 cm is:
P(168 cm < Height < 180 cm) = P(-1.17 < Z < 0.83) = 0.7967 – 0.1210 ≈ 0.6757 or 67.57%.
Example 2: Exam Scores
Suppose the scores of a standardized exam follow a normal distribution with a mean score (μ) of 80 and a standard deviation (σ) of 10. Find the score below which 80% of the students scored.
Solution:
We are given μ = 80 and σ = 10.
To find the score below which 80% of the students scored, we need to find the value (x) corresponding to the 80th percentile. This is equivalent to finding the Z-score corresponding to the 80th percentile and then using the Z-score formula to find the corresponding value (x).
Using the Z-table or a statistical calculator, we find the Z-score corresponding to the 80th percentile is approximately 0.84.
Now, using the Z-score formula:
Z = (x – μ) / σ
0.84 = (x – 80) / 10
Solving for x:
x = 0.84 * 10 + 80 = 8.4 + 80 = 88.4
So, the score below which 80% of the students scored is approximately 88.4.
Applications of normal distribution
The normal distribution has wide-ranging applications across various fields due to its mathematical properties and prevalence in real-world phenomena. Some key applications include:
- Statistical Analysis: The normal distribution serves as a foundation for various statistical methods, including hypothesis testing, confidence intervals, and regression analysis.
- Quality Control: It is used to model and monitor process variations in industries, ensuring products meet quality standards.
- Finance: Normal distribution is used to model stock returns, interest rates, and asset prices in financial modeling and risk analysis.
- Psychology: It is used to study and analyze psychological traits, such as IQ scores and personality traits.
- Natural Sciences: In biology, physics, and other natural sciences, normal distribution models characteristics like height, weight, and reaction times.
- Social Sciences: It is used in social research to model survey responses, voting patterns, and other human behaviors.
- Predictive Modelling: It is used to forecast future trends and estimate probabilities of various events.
- Educational Testing: Normal distribution is employed in standardizing test scores, such as SAT and IQ tests.
- Medical Research: It is used to analyze medical data, like blood pressure, cholesterol levels, and drug effectiveness.
- Quality Assurance: Normal distribution is used in Six Sigma methodology to assess process capability and control.
The normal distribution’s versatility and widespread use make it an essential tool for statisticians, researchers, and analysts in numerous fields, facilitating accurate modeling, prediction, and decision-making.The following equation describes the relationship between drift velocity (v_d) and current density (J) in a conductor:
Frequently asked questions on Normal distribution
What are the five properties of Normal distribution
The normal distribution possesses several important properties that make it a unique and widely used probability distribution. Here are five key properties of the normal distribution: Bell-Shaped Curve: The normal distribution is characterized by a symmetric, bell-shaped curve. The highest point of the curve represents the mean, and data points cluster around it. Mean, Median, and Mode: In a normal distribution, the mean, median, and mode are all equal. This property holds for symmetrical distributions. Standard Deviation: The spread of data in a normal distribution is determined by the standard deviation (σ). The larger the standard deviation, the wider the curve. Empirical Rule: The empirical rule states that approximately 68% of the data falls within one standard deviation from the mean, about 95% within two standard deviations, and almost 99.7% within three standard deviations. Central Limit Theorem: The central limit theorem states that the sum of a large number of independent, identically distributed random variables will approximate a normal distribution, regardless of the underlying distribution. These properties make the normal distribution a fundamental tool in statistics and probability theory, widely used in various fields to model real-world phenomena and make statistical inferences.
Why is it called normal distribution?
The adjective normal comes from the Latin word normalis, which means according to the norm or standard. The name reflects the frequency of this distribution in a variety of natural events, as well as its use as a basic and fundamental model in statistics and probability theory.
What is normal distribution with example?
A symmetrical probability distribution with a bell-shaped curve is the normal distribution, commonly known as the Gaussian distribution. Its mean and standard deviation characterise it completely. A population's height distribution, for example, shows that most people cluster around the average height, generating a bell curve around the mean height.
What are the basics of normal distribution:
The basics of normal distribution include its symmetrical, bell-shaped curve, defined by mean (μ) and standard deviation (σ). The empirical rule highlights that about 68%, 95%, and 99.7% of data fall within one, two, and three standard deviations from the mean, respectively. It is widely used in statistics for modeling and inference.
What is the other name of normal distribution?
The normal distribution is sometimes known as the Gaussian distribution. Both phrases allude to the symmetrical, bell-shaped probability distribution that is defined by its mean and standard deviation. The term Gaussian comes from the mathematician Carl Friedrich Gauss, who investigated and contributed to the features of this distribution extensively.
What is the shape of normal curve?
The shape of a normal curve is symmetrical and bell-shaped. The curve is characterized by a single peak at the mean, and data points are evenly distributed on both sides of the mean. As we move away from the mean, the curve gradually tapers, resulting in a smooth and continuous decline towards the tails on both ends of the curve.
What is the importance of normal distribution?
Because of its frequency in real-world occurrences, the normal distribution is crucial in statistics and probability theory. It enables researchers to make precise predictions, model numerous processes, and test hypotheses. Its mathematical features, as well as the Central Limit Theorem, make it a critical tool for data analysis and decision-making.
What is z in normal distribution
In the context of the normal distribution, z refers to the standard score or Z-score. The Z-score is a measure of how many standard deviations a particular data point is away from the mean of the distribution. It is calculated using the formula: Z = (X - μ) / σ where: Z is the Z-score X is the value of the data point μ is the mean of the distribution σ is the standard deviation of the distribution The Z-score helps standardize data and allows for comparisons across different datasets with varying means and standard deviations. It also facilitates the calculation of probabilities and the identification of outliers in a normal distribution. A Z-score of 0 indicates the data point is at the mean, a positive Z-score means the data point is above the mean, and a negative Z-score means it is below the mean.


