Table of Contents
In statistics, two concepts often get mixed up: correlation and regression. These terms may seem similar, but they have distinct meanings and applications. As a student, it’s crucial to distinguish between correlation and regression to grasp their unique roles in data analysis.
This article aims to clarify the correlation and regression differences and highlight their importance in statistical studies.
What is Correlation?


At its core, correlation refers to the statistical relationship between two variables. When we talk about the correlation and regression difference, it’s important to note that correlation measures the strength and direction of a linear relationship between two variables. However, unlike regression, correlation does not imply causation.
In trying to distinguish between correlation and regression, remember that correlation is a preliminary step in data analysis, providing a numerical value (correlation coefficient) that indicates how closely two variables move in relation to each other.
This coefficient ranges from -1 to +1, where +1 indicates a perfect positive relationship, -1 a perfect negative relationship, and 0 no relationship at all. This understanding is crucial when exploring the broader context of correlation and regression.
There are three main types of correlations, each describing the relationship between two variables:
- Linear Correlation: Imagine two variables like height and weight. If someone’s height increases by one inch, their weight typically increases by a constant amount, like two pounds. This “constant rate of change” is the hallmark of a linear correlation. The graph of this relationship would be a straight line.
- Non-Linear Correlation: Sometimes, the relationship between two variables isn’t so straightforward. For example, as you study more for an exam, your score might improve rapidly at first but then plateau as you reach your maximum potential. This is a non-linear correlation, and its graph would be a curve, like a parabola or hyperbola, instead of a straight line.
- Monotonic Correlation: Imagine two variables like temperature and ice cream sales. As the temperature rises, ice cream sales generally go up. However, the increase in sales might not be consistent at every temperature. This is a monotonic correlation, meaning both variables move in the same direction (up or down) but not necessarily at a constant rate.
Understanding these different types of correlations can help us analyze and interpret data more effectively. Knowing whether two variables have a linear, non-linear, or monotonic relationship can inform our predictions and decisions based on the data.
What is Regression?
Regression is a statistical method that analyzes the average relationship between two or more variables. This technique helps to predict changes in a dependent variable, often a metric, in response to changes in one or more independent variables. Its usefulness spans various human activities, serving as a potent and adaptable tool for forecasting future outcomes based on past or current data. For instance, a business’s future profits can be predicted using historical financial records.
In the context of simple linear regression, there are typically two variables involved: x and y. In this relationship, y is dependent on, or influenced by, x. Here, y is termed the dependent variable, or criterion, while x is known as the independent variable, or predictor. The regression equation, which represents the relationship between y and x, is formulated as:
Y=a+bx
In this equation, ‘a’ represents a constant, and ‘b’ is the regression coefficient. These two parameters, a and b, are key in defining the regression line of y on x, offering a mathematical way to understand and predict the behavior of the dependent variable based on changes in the independent variable.


Differences Between Correlation and Regression
While often mentioned together, correlation and regression are distinct statistical concepts with unique characteristics. To grasp the nuances between them, we need to consider four key aspects where they fundamentally differ.
- Nature of Relationship: Correlation is centered around identifying the presence and strength of a relationship between variables. It measures how variables move together, but it doesn’t imply any cause-effect relationship. On the other hand, regression is focused on how changes in one variable (independent) influence or predict changes in another (dependent). This distinction is critical for understanding the depth of the analysis each method provides.
- Causality: Correlation does not address causality; it simply indicates the degree to which two variables have a linear relationship. In contrast, regression can be used to infer causal relationships. By modeling the dependence of one variable on another, regression can suggest how and to what extent one variable affects the other.
- Symmetry: The correlation between two variables, x and y, is symmetric – the correlation from x to y is the same as from y to x. However, this symmetry doesn’t hold in regression. The regression of y on x (predicting y using x) can yield very different results compared to the regression of x on y (predicting x using y). This asymmetry in regression highlights its predictive nature.
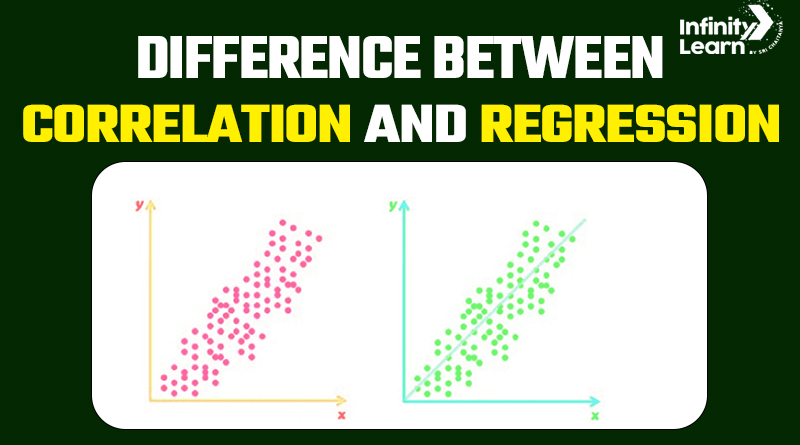
- Graphical Representation: Graphically, a correlation is often represented as a single point in a scatter plot, showing the degree to which x and y are related. In linear regression, however, the relationship is visualized as a line. This line, known as the regression line, maps out the predicted values of the dependent variable based on the independent variable, offering a visual interpretation of how one variable affects the other.
To simplify this, let’s look at a table summarizing the key distinctions:
| Aspect | Correlation | Regression |
| Definition | Measures the strength and direction of a linear relationship. | Predicts the value of a dependent variable based on independents. |
| Purpose | To find the association or relationship between two variables. | To estimate the relationship and make predictions. |
| Implication | Does not imply causation. | Can imply causation under certain conditions. |
| Outcome | Correlation coefficient (ranging from -1 to +1). | Regression equation (linear, polynomial, etc.). |
| Direction | Bidirectional (assesses the degree of association). | Unidirectional (from independent to dependent variable). |
While correlation and regression are closely linked, they serve different purposes in data analysis. Understanding the difference between correlation and regression is essential for accurate interpretation of statistical results.
Remember, correlation indicates the degree to which variables are related, while regression shows how one variable affects another. This knowledge is pivotal for students, especially those in Class 10, to develop a foundational understanding of these concepts in a simple, straightforward manner.
FAQs on Difference Between Correlation and Regression
What is difference between correlation and regression?
Correlation is a statistical measure that describes the extent to which two variables change together, but it does not imply causation. It quantifies the strength and direction of the relationship (positive, negative, or no correlation). Regression, on the other hand, is used to understand the relationship between dependent and independent variables. It is used to create a model or equation to predict or estimate one variable based on the value of another. Regression analysis implies a cause-and-effect relationship and is used for prediction.
What are the 3 types of correlation?
Positive Correlation: Both variables increase or decrease together. As one variable increases, so does the other. Negative Correlation: As one variable increases, the other decreases, and vice versa. No Correlation: There is no apparent relationship between the variables; changes in one do not predict changes in the other.
What is regression and correlation in big data?
In the context of big data, both regression and correlation are used to analyze large and complex datasets. Correlation in big data helps identify relationships between different data points or features. It's useful in exploratory data analysis to understand how variables are connected. Regression in big data is used for predictive modeling. It involves creating models that can predict a target variable based on one or more input variables. With big data, regression models can handle large, complex datasets, often with multiple variables and intricate relationships


