
Table of Contents
Introduction to Statistics


Statistics is an important field of mathematics. It focuses on the collection, analysis, interpretation, presentation, and organisation of data. It involves gathering data, sorting it into meaningful categories, and then presenting it in a way that makes it easier to understand. Through statistical methods, we can draw conclusions from data collected through surveys or experiments.
This article will discuss Statistics, its types, and methods of representation and calculation.
Role of Statistics
Statistics plays a crucial role across various sectors, including psychology, sociology, and geology. By applying statistical techniques, professionals in these fields can do surveys, make the best decisions and gain insights from their data. They can easily study the changing trends, evaluate results, or make predictions. Therefore, statistics is an essential tool for understanding the world around us.
Also Check: Statistics & Probability for JEE


Types of Approaches in Statistics
Today, statistics uses advanced mathematical techniques, including linear algebra, differential equations, mathematical analysis, and probability theory. These methods help in studying and interpreting data more effectively.
There are two main approaches in mathematical statistics:
- Descriptive Statistics
- Inferential Statistics
Both methods are crucial for analysing data and drawing meaningful conclusions in various domains.
Descriptive Statistics
Descriptive statistics is used to summarise and describe the main features of a dataset. It focuses on presenting data through measures of central tendency (like mean, median, and mode) and measures of dispersion (such as range, variance, and standard deviation). This method provides a clear and concise overview of the data’s key characteristics.
Inferential Statistics
Inferential statistics involves drawing conclusions and making predictions based on data samples. This method relies on statistical tests to analyse the differences between groups. A key aspect of inferential statistics is hypothesis testing, where the p-value is calculated and compared to a predetermined significance level (α), commonly set at 0.05. If the p-value is less than α, the result is considered statistically significant, indicating a meaningful difference between the groups being studied.


Data Representation in Statistics
Data refers to the collection of observations and facts. It can be expressed in various forms such as numbers, measurements, or statements. Data is categorised into two main types:
- Qualitative Data: This type of data is descriptive or categorical. It represents characteristics or qualities that can be observed but not measured numerically.
- Quantitative Data: This data consists of numerical information that can be measured and quantified.
Once data is collected, it needs to be represented in a clear and organised manner. Various graphical forms are used to represent data, including:
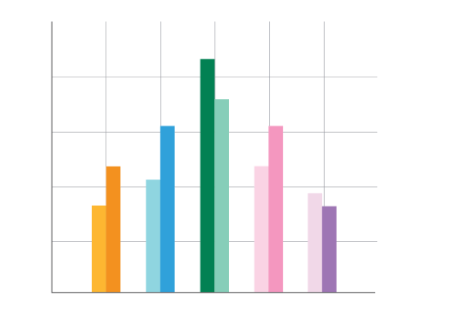
- Bar Graph: A bar graph displays data using rectangular bars, where the length of each bar corresponds to the value it represents.
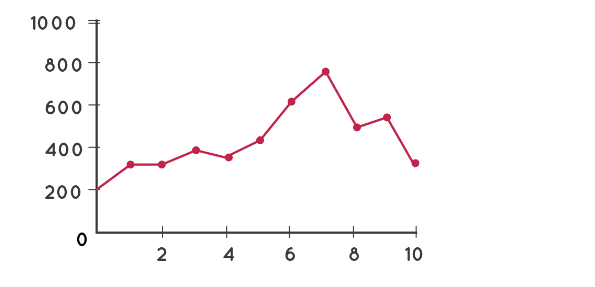
- Line Graph: A line graph shows data points connected by lines, useful for tracking changes over time.
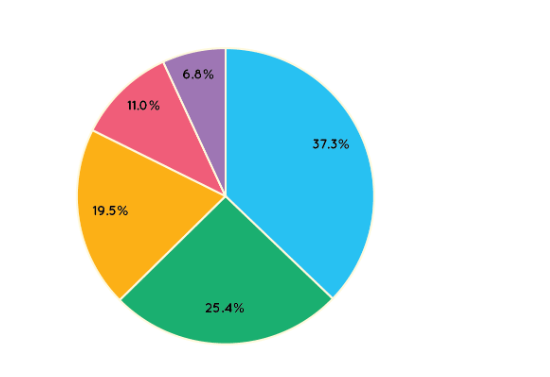
- Pie Chart: A Pie Chart represents data as segments of a circle, each segment showing the proportion of a whole.
- Stem-and-Leaf Plot: A Stem-and-Leaf Plot displays data in a way that retains the original data values while organising them into groups.
- Scatter Plot: A Scatter Plot uses dots to represent the values of two different variables, helping to identify relationships or trends.
Data Representation Methods in Statistics
Below discussed are a few methods of data representation.
Bar Graph
A bar graph displays data using rectangular bars. The length of each bar is proportional to the value it represents. Bars can be oriented either vertically or horizontally, making it easy to compare different categories.
Pie Chart
A pie chart is a circular graph divided into sectors, with each sector representing a portion of the whole. This visual helps in understanding the relative sizes of different categories as parts of a whole.
Line Graph
A line graph presents data as a series of points connected by straight lines. Each point, called a marker, represents a data value. This type of graph is useful for showing trends and changes over time.
Pictograph
A pictograph uses pictures or symbols to represent data. Each picture or symbol corresponds to a specific quantity, making it easier to visualise and understand the data through images.
Histogram
A histogram is a type of bar graph where the bars represent the frequency of data within specific intervals. The height of each bar shows the frequency, and the width of each bar corresponds to the class interval. Histograms are useful for displaying the distribution of data.
Frequency Distribution Table
This table organises data in ascending order and shows how often each value occurs. The frequency of each data point is typically represented by f, providing a clear view of data distribution.
Different Models of Statistics
Statistics includes various models and methods made for different requirements as per analysis done. Here are some basic models:
Skewness
Skewness measures the asymmetry of a probability distribution. It indicates how much and in which direction the distribution deviates from a normal distribution. The skewness value can be positive, negative, or zero:
- Positive Skewness: The distribution tail extends more to the right, with the bulk of data concentrated on the left.
- Negative Skewness: The distribution tail extends more to the left, with the bulk of data concentrated on the right.
- Zero Skewness: The distribution is symmetrical around the mean.
ANOVA Statistics (Analysis of Variance)
ANOVA is a statistical method used to determine whether there are differences between the means of three or more groups. It helps compare the performance of different groups or variables over time, such as evaluating stock performance across different periods.
Degrees of Freedom
Degrees of freedom refer to the number of independent values or quantities that can be assigned to a statistical estimate. It represents the number of values that can vary while estimating parameters. In essence, it helps account for the number of independent pieces of information available for analysis.
Regression Analysis
Regression analysis is a statistical technique used to understand the relationship between variables. It examines how a dependent variable changes in response to variations in one or more independent variables. This model is crucial for predicting outcomes and assessing relationships in various fields.
Measures of Central Tendency in Statistics
Measures of central tendency are fundamental aspects of descriptive statistics, providing insights into the centre or typical value of a dataset. They help us understand where data points are gathered around a central value. This is essential for analysing how data is distributed around this central point. The key measures of central tendency include:
Arithmetic Mean
Arithmetic Mean is commonly known as the average, the arithmetic mean is calculated by summing all data points and dividing by the number of points. It provides a central value that represents the entire dataset.
Median
The median is the middle value of a dataset when it is arranged in ascending or descending order. If there is an even number of observations, the median is the average of the two middle values. The median is useful for understanding the centre of a dataset, especially when it is skewed or contains outliers.
Mode
The mode is the value that occurs most frequently in a dataset. A dataset may have one mode, more than one mode, or no mode at all if no value repeats. It is particularly useful for categorical data.
Geometric Mean
The geometric mean is calculated by taking the nth root of the product of n values. It is used primarily for datasets involving rates of growth or when comparing ratios, such as financial returns over time.
Harmonic Mean
The harmonic mean is determined by dividing the number of observations by the sum of the reciprocals of each value. It is particularly useful for datasets involving rates or ratios, such as speed or density.
Statistics Practice Questions
- Calculate the arithmetic mean of the following set of numbers: 5, 10, 15, 20, 25.
- Find the median of this dataset: 7, 3, 5, 12, 8.
- Determine the mode of the following list of numbers: 4, 7, 8, 4, 9, 4, 10.
- Calculate the geometric mean of the numbers: 2, 8, 32.
- Find the harmonic mean of the following values: 4, 6, 12.
- The mean score of 10 students in a class is 85. If 5 more students join with an average score of 90, what is the new mean score for all 15 students?
- Find the median of this dataset: 14, 20, 23, 25, 30, 34.
- In a survey of 15 people’s favourite colours, the results are Blue, Red, Blue, Green, Red, Blue, Green, Blue, Yellow, Red, Red, Green, Blue, Yellow, Blue. What is the mode?
FAQs on Statistics
What do you mean by statistics?
Statistics is a branch of mathematics that deals with the collection, organization, analysis, interpretation, and presentation of data. It involves studying numerical data to gain insights, make predictions, and draw conclusions. Statistics is used in various fields such as business, economics, social sciences, and scientific research to make informed decisions based on data.
What are the 3 types of statistics?
The three main types of statistics are: Descriptive statistics: This involves summarizing and describing the characteristics of a dataset, such as the mean, median, mode, and standard deviation. Inferential statistics: This type of statistics is used to make inferences about a population based on a sample. It involves hypothesis testing, confidence intervals, and regression analysis. Predictive statistics: This type of statistics is used to make predictions about future events or outcomes based on past data. It involves techniques such as forecasting and machine learning.
What are the 5 basic statistics?
The five basic statistics are: Mean: The average value of a dataset, calculated by summing all the values and dividing by the number of data points. Median: The middle value in a dataset when the values are arranged in order. Mode: The value that appears most frequently in a dataset. Range: The difference between the highest and lowest values in a dataset. Standard deviation: A measure of the spread or dispersion of a dataset from its mean.
What is the T test?
The T-test is a type of inferential statistical test used to determine if there is a significant difference between the means of two groups. It is commonly used when the sample size is small or when the population standard deviation is unknown. The T-test can be used in various scenarios, such as comparing the performance of two treatments or testing if a new product has a higher mean sales than the existing product.
Who is the father of statistics?
Sir Francis Galton is often referred to as the father of statistics due to his significant contributions to the field. Galton was a Victorian-era polymath who made important discoveries in various areas, including biology, psychology, and statistics. He is known for his work on regression and correlation, which laid the foundation for modern statistical analysis. Galton also introduced the concepts of standard deviation and the normal distribution curve.


