Table of Contents
Introduction to Spectral Lines


One of the most prominent topics in Chemistry is light. Several studies have been conducted to explain various aspects of light, such as how it moves, how it reflects, and so on. The spectral lines are another essential topic. Let us first look at the spectral series of hydrogen atoms.
The spectral series is shown by lines. The Rydberg formula can be used to compute when an element’s atoms are energized and emit light rays from higher energy levels to lower energy levels.
Definition of Spectral Lines
The spectral lines represent the dark or bright line in an apparently uniform and continuous spectrum that results from light emission or absorption in a narrow frequency range when compared to surrounding frequencies. Spectral lines are frequently employed to distinguish between atoms and molecules.


Splitting of spectral lines
The splitting of spectral lines observed when radiating atoms, ions, or molecules are subjected to an intense electrical field is known as the Stark effect. Johannes Stark (1913), a German scientist, discovered the electric analogue of the Zeeman effect (i.e., the magnetic splitting of spectral lines).
Hence, there are two types of splitting of spectral lines, which are known as:
- Stark effect
- Zeeman effect
Intensity of spectral lines
At a particular frequency, the intensity of spectral lines is proportional to the net rate of absorption (or emission).
As a result, no lines are recorded at frequencies that do not correspond to a transition between two energy states; because no absorption can occur at these frequencies, the intensity of spectral lines at this frequency is zero, indicating that no line is observed.
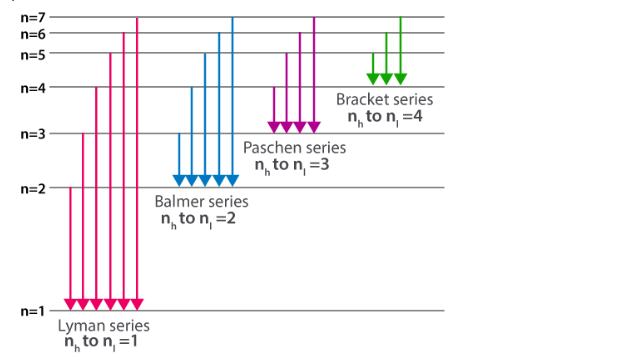
Spectral series
Every atom has a collection of energy levels/states that can be described and explained using Bohr’s atomic model by the spectral series. He assigns quantum numbers to energy levels (n = 1,2,3,4,5,6,…..). When electrons move from higher energy levels (nh) to lower energy levels (nl), they emit an energy photon. Because the energy associated with each state is fixed, the difference between energy states is also fixed. As a result, the transition between similar energy levels results in the production of the same energy photon.
The electron transition to a lower energy state divides the spectral series into equivalent series.


Width of spectral lines
If the spectral line is sharp, it has no width and can only be observed at a single frequency. If the spectral line is broad, it will have a certain width, indicating that it is dispersed throughout a range of frequencies. This explains the width of spectral lines.
Also Check for:
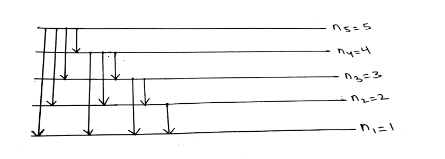
Total number of spectral lines in UV region
The figure depicts the total number of spectral lines in UV region. There are ten possible transitions.
Fine structure of spectral lines
The fine structure of spectral lines depicts the splitting of spectral lines caused by electron spin as well as the relativistic correction to the total energy of the hydrogen atom electron. When electrons absorb energy and move from lower to higher energy levels, they become unstable and shed energy in the form of photons of different wavelengths, resulting in a spectrum.
Spectral lines formula (Number of spectral lines)
The number of spectral lines formula = (n2-n1)(n2-n1+1)/2 This is a list of possible numbers. However, in the visible region, when an electron hops from n2 = 5 to n1 = 1, the number of spectral lines formula=(5-1)(5-1+1)/2=10 is used.
So, 5 to 4, 5 to 3, 5 to 2, 5 to 1, 4 to 3, 4 to 2, 4 to 1, 3 to 2, 3 to 1, 2 to 1 are the options. However, visible regin is mentioned here, i.e., the Balmer series. so xz & y=3,4,5. So the odds are 5 to 2, 4 to 2, and 3 to 2. That is, three spectral lines are calculated from no of spectral lines formula.
Frequently Asked Questions on Spectral Lines
What are spectral lines 12th?
A spectrum line is a narrow band of brilliant or dark light. They are produced by the emission or absorption of atoms and molecules. Each sort of atom and molecule has its own set of spectrum lines. As a result, these spectrum lines are utilized to identify a substance's composition.
How many spectral lines are in hydrogen?
A hydrogen atom has six distinct spectral lines. When an electron transitions from a higher energy state to a lower energy state, spectral emissions occur. The no of spectral lines in the spectral spectrum is arranged into series based on their lower energy level.
What is spectral line formula?
The Formula for number of spectral lines in general. =2 (n2−n1)(n2−n1+1).
What is line spectrum and types?
Line spectra are classified into two types: emission and absorption. In an emission spectrum, electrons are driven to an excited state by thermal or electrical means, then relax to a lower state and emit a photon of light at a certain energy, which is visible as at a specific wavelength.
Who discovered spectral lines?
In 1814, the German optician Joseph von Fraunhofer independently discovered spectral lines. Fraunhofer built a spectroscope by placing a prism in front of a tiny telescope. He was able to map over 570 spectral lines using this new technology, giving rise to the branch of study known as spectroscopy.


