CBSE Class 6 Maths Notes Chapter 9 Data Handling


In our day to day life, we see various kinds of tables which consist of numbers, figures, names, etc. These tables provide ‘Data’. Data is a collection of numbers gathered to give some information.
Recording Data
Sometimes some information is required very quickly. It is possible only when we adopt some suitable system of collecting data.
| Raghav | Banana |
| Preeti | Apple |
| Amar | Guava |
| Bawana | Apple |
| Manoj | Banana |
| Donald | Apple |
| Fatima | Orange |
| Raman | Banana |
| Radha | Orange |
| Rarida | Guava |
| Anuradha | Banana |
| Rati | Banana |
| Maria | Banana |
| Akhtar | Orange |
| Ritu | Apple |
| Salma | Banana |
| Kavita | Guava |
| Javed | Banana |
Organising Data
If we want to get particular information from the given data quickly, die data can be arranged in a tabular form using tally marks.
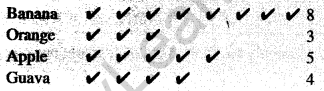
Pictograph
A pictograph represents data in the form of pictures, objects or parts of objects. The picture usually helps to understand the data. It helps answer the questions on the data at a glance. Pictographs are often used by dailies and magazines to attract the attention of the readers. However, it requires some practice to understand the information given by a pictograph.
Interpretation of a Pictograph
Simply by observing a pictograph, one can answer the related questions very quickly.
Drawing a Pictograph
We draw pictographs using symbols to represent a certain number of items or things.
A Bar Graph
Representing data by pictograph is tedious and time-consuming. So, a bar graph supplies with another way of representing data visually.
In a bar graph or a bar diagram, bars of uniform width is erected horizontally or vertically with equal spacing between them. The length of the bar gives the required information.
Interpretation of a bar graph
Looking at the bar graph; we can answer the related questions quite easily.
Drawing a Bar graph
First of all, we draw a horizontal line and a vertical line on the horizontal line, we drawbars and on vertical line, we write the numerals. However, we choose a proper scale. For example, 1 unit =100 students. Good practice helps reading a given bar graph a lot.


