Supply – CBSE Notes for Class 12 Micro Economics


Introduction
Numerical based chapter explaining Supply, determinants of individual supply and market supply, law of supply, movement along the supply, shift in supply, reasons and exceptions to the law of supply, price elasticity of supply and ways to measure it. It also takes into account the factors affecting the price elasticity of supply and concept of time horizon.
1. Stock refers to total quantity of a particular commodity that is available with the firm at a particular point of time.
2. (a) Supply refers to the quantity of a commodity that a firm is willing and able
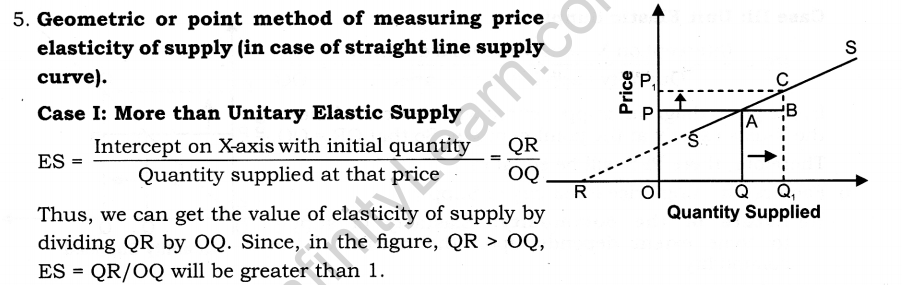
to offer for sale, at each possible price during a given period of time.
(b) In other words, supply is that part of stock which is actually brought into the market for sale. Stock can never be less than supply.
(c) For example, a seller has a stock of 50 tonnes of sugar in the go down. If the seller is willing to sell 30 tonnes at a price of Rs. 37 per kg, then supply of 30 tonnes is a part of total stock of 50 tonnes.
3. Market supply refers to the quantity of a commodity that all firms are willing and able to offer for sale at each possible price during a given period of time.
4. Factors affecting personal (individual) supply:
(a) Price of the commodity:
(i) Positive relationship exists between price of the commodity and supply of that commodity.
(ii) It means, with the rise in price of the commodity, the supply of that commodity also rises and vice-versa.
(b) Price of the factors of production:
(i) This also influences the supply since price of factors (rent, wages, interest, profit) constitutes the cost of production of a commodity.
(ii) An increase in the price of a factor of production may lead to fall in production of a commodity shifting the supply curve to the left.
(iii) As against it, a producer may supply more of a commodity at a given price if the prices of factors fall shifting the supply curve to the right.
(c) State of technology:
(i) When there is technological progress in the firm, then cost of production will decrease, which leads to increase in the profit margin of the firm and thereby shifts the supply curve rightward.
(ii) Supply of those goods which are being produced with old and inferior technology causing increase in cost of production will decrease the total output and shift the supply curve to the left.
(d) Unit tax:
(t) A unit tax is a tax that the government imposes per unit sale of output.
(ii) For example, suppose that the unit tax imposed by the government is ? 3. Then, if the firm produces and sells 20 units of the goods, the total tax that the firm must pay to the government is 20 * 3 = 60.
(iii) So, if the unit tax increases, the firm’s cost of production increases which will shift the supply curve leftward. Similarly, if the unit tax decreases, the firm’s cost of production decreases, which will shift the supply curve rightward.
(e) Price of other goods:
(i) Suppose a firm produces more than one product with its given resources.
(ii) An increase in the price of other goods induces the firm to produce more of other goods to earn more profit and less of goods whose prices remained unchanged.
(f) Objective of the firm:
(i) Sometimes a firm may be induced to increase supply of a commodity not because it is more profitable, but because its supply is a source of status and prestige in the market.
(ii) Similarly, a firm may increase production just to achieve the goal of maximum sale or maximum employment.
5. Factors affecting Market supply:
(a) Price of the commodity
(b) Price of the factors of production
(c) State of technology
(d) Unit tax
(e) Price of other goods
(f) Objective of the firm
(g) Number of firms in the market:
(i) When the number of firms in the industry increases, market supply also increases due to large number of producers producing that commodity.
(ii) However, market supply will decrease, if some of the firms start leaving the industry due to losses.
(h) Future Expectation regarding price:
(i) If sellers expect a rise in price in near future, current market supply will decrease in order to raise the supply in future at higher prices.
(ii) However, if the sellers fear that the prices will fall in the future, they will increase the present supply to avoid losses in future.
(i) Means of transportation and communication: Proper infrastructural
development, like improvement in the means of transportation and communication, helps in maintaining adequate supply of the commodity.
6. Supply function shows the relationship between quantity supplied for a particular commodity and the factor influencing it.
7. Individual supply function refers to the functional relationship between supply and factors affecting the supply of a commodity.
It is expressed as, Sx = f (Px , P0 , Pf, St , T, O) Where, Sx = Supply of the given commodity x.
Px= Price of the given commodity x.
P0 = Price of other goods.
Pf = Prices of factors of production.
St= State of technology.
T = Taxation policy.
O = Objective of the firm.
8. (a) Market supply function refers to the functional relationship between market supply and factors affecting the market supply of a commodity.
(b) As we know, market supply is affected by all the factors affecting the individual supply.
(c) In addition, it is also affected by some other factors like number of firms, future expectations regarding price and means of transportation and communication. Market supply function is expressed as, Sx = f(Px, P0, Pf, St, T, O, N, F, M)
Where, Sx = Market supply of given commodity x.
Px= Price of the given commodity x.
P0 = Price of other goods.
Pf = Prices of factors of production.
St= State of technology.
T = Taxation policy.
O = Objective of the firm.
N = Number of firms.
F = Future expectation regarding price of given commodity x.
M = Means of transportation and communication.
9. Supply schedule is a table showing various quantities of a commodity offered for sale corresponding to different possible prices of that commodity.
Supply schedule is of two types:
(a) Individual supply schedule
(b) Market supply schedule.
10. Individual supply schedule refers to the supply schedule of an individual firm in the market.
Table shows a hypothetical supply schedule for commodity ‘x’.
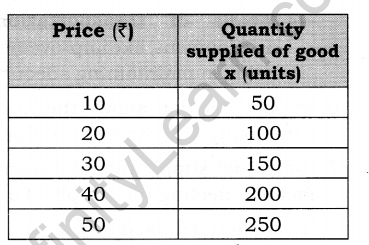
As seen in the schedule, quantity supplied of commodity x increases with the increase in price. The producer is willing to sell 50 units of x at a price of ? 10. When the price rises to ? 20, supply also rises to 100 units.
11. Market supply schedule refers to supply schedule of all the firms in the market producing a particular commodity.
It is obtained by adding all the individual supplies at each and every level of price. Market supply is calculated as, SM= SA + SB + ….
Where Sm is the market supply and SA + SB+ … are the individual supply of supplier A, supplier B and so on.
Let us understand the derivation of market supply schedule with the help of Table (Assuming that there are only 2 producers A and B in the market).
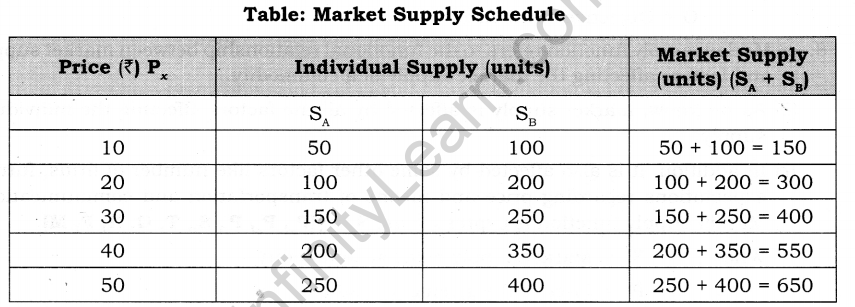
As seen in table market supply is obtained by adding the supplies of suppliers A and B at different prices. At price of Rs. 10 market supply is 150 units. When price rises to Rs. 20, market supply rises to 300 units. So, market supply schedule also shows the direct relationship between price and quantity supplied.
12. Supply curve refers to a graphical representation of supply schedule. It shows direct relationship between price and quantity supplied, keeping other factor constant. Supply curve is of two types:
(a) Individual Supply Curve (b) Market Supply Curve
13. (a) Individual supply curve refers to a graphical representation of individual supply schedule.
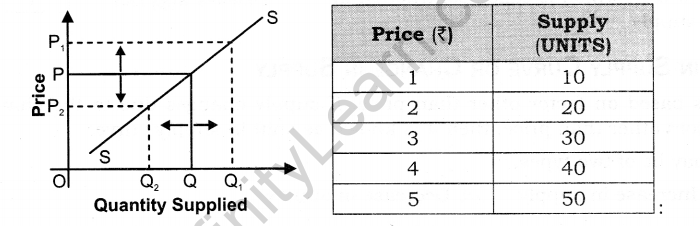
(b) With the help of information given in supply schedule (see table), the supply curve for an individual firm can be drawn as shown in figure:
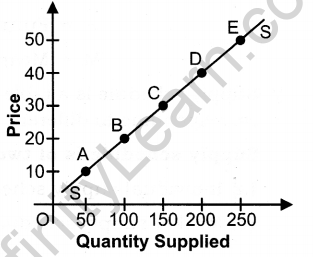
(c) In figure, quantity supplied is taken on the horizontal axis and price on the vertical axis. At each possible price, there is a quantity, which the firm is willing to sell.
(d) Point ‘A’ shows that 50 units are supplied at the price of Rs. 10. Point ‘B’ shows that 100 units are supplied at Rs. 20.
(e) By joining all the points (A to E), we get a curve that slopes upward. The supply curve SS slopes upward due to positive relationship between price and quantity supplied.
14. (a) Market supply curve refers to a graphical representation of market supply
schedule. It is obtained by horizontal summation of individual supply curves.
(b) Let us graphically convert the market supply schedule (table) into a market supply curve (see figure).
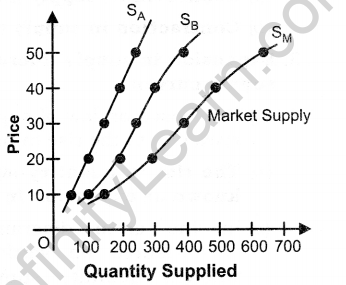
(c) As seen in the diagram, quantity supplied is shown on the horizontal axis and price on the vertical axis. and SB are the individual supply curves.
Market supply curve (SJ) is obtained by horizontal summation of the individual supply curves.
(d) At the price of Rs. 10 per unit both the firms will supply a total number of 150 units. When price rises to Rs. 20 per unit, market supply rises to 300 units.
(e) Market supply curve is also positively sloped
due to positive relationship between price and quantity supplied. Quantity Supplied
15. Market supply curve is flatter than all individual supply curves. It happens because with a rise in price, the proportionate rise in market supply is more than the proportionate rise in individual supplies.
16. (a) Other things being constant (Ceteris Paribus), based on price of the commodity; then it is known as Law of Supply.
It means, quantity supplied of the commodity rises due to rise in price of the commodity and vice-versa.
(b) Ceteris Paribus means:
(i) Price of other commodity remains constant.
(ii) Technology of production should not change.
(iii) Cost of production remains constant.
(iv) Taxation policy of the government should not change.
(v) Objective of the firm remains constant.
(c) The law of supply makes a qualitative statement only and not quantitative. It indicates the direction of change in the amount supplied and it does not indicate the magnitude of change.
(d) Law of supply is one sided. It explains only the effect of change in price on the quantity supplied. It states nothing about the effect of change in quantity supplied on the price of the commodity.
(e) The schedule and diagram are as follows:
Movement Along The Supply Curve Or Change In Quantity Supplied
1. It is based on law of supply which states that quantity supplied of the commodity changes due to the change in price of the commodity.
2. The change in quantity supply due to the change in the price of the commodity is known as Movement along the supply curve. It may be of two types; namely,
(a) Expansion in supply (increase in quantity supplied)
(b) Contraction in supply (decrease in quantity supplied)
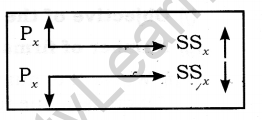
3. Expansion in supply (increase in quantity supplied or upward movement along supply curve):
(a) It is based on law of supply which states that quantity supplied of a commodity rises due to the rise in price of the commodity.
(b) The rise in quantity supplied due to the rise in price of the commodity is known as expansion in supply.
(c) In the given diagram price is measured on vertical axis whereas quantity supplied is measured on horizontal axis.
A producer is supplying OQ quantity at OP price. But, due to the rise in price from OP to OP1, the quantity supplied increases from OQ to OQ1; which is known as expansion in supply.
4. Contraction in supply (decrease in quantity supplied or Downward movement along Supply Curve):
(a) It is based on law of supply which states that quantity supplied of a commodity falls to the fall in the price of the commodity.
(b) The fall in the quantity supplied due to the fall in price of the commodity is known as contraction in supply.
(c) In the given diagram, quantity supplied is measured on horizontal axis and price is measured on vertical axis. A producer is supplying OQ quantity at OP price.
But, due to fall in price from OP to OP1, the quantity supply falls from OQ to OQ1, which is called contraction in supply.
Shift In Supply Curve Or Change In Supply
1. It is based on factor other than price. If supply changes due to the change in the factors other than price, then it is known as shift in supply curve.
2. It may be of two types:
(a) Increase in supply (b) Decrease in supply
(a) Increase in supply:
(i) An increase in supply means that producers now supply more at a given level of price of a commodity.
(ii) It’s conditions are:
• Fall in the prices of remuneration of factors of production.
• Fall in the prices of other commodities.
• Improvement in technology.
• Taxation policy of government falls.
• Change in objective of producer (inducing them to increase supply at the same price.)
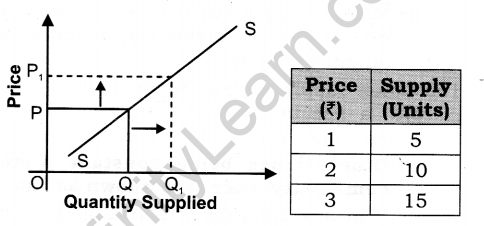
(iii) In the given diagram price is measured on vertical axis whereas, quantity supplied is measured on horizontal axis. A producer is supplying OQ quantity at OP price.
But, due to the changes in the factors other than price, the supply curve shifts rightward from SS to S1S1.
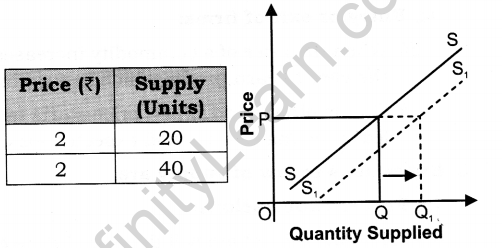
With the rightward shift in supply curve from SS to S1S1, the quantity supplied rises from OQ to OQ1; which is known as increase in supply.
(b) Decrease in Supply:
(i) A decrease in supply means that producers now supply less at a given level of price of a commodity.
(ii) It’s conditions are:
• Rise in the prices of remuneration of factors of production.
• Rise in the prices pf other goods.
• When the technology becomes outdated.
• Taxation policy of government rises.
• Change in objective of producer (inducing them to decrease supply at the same price).
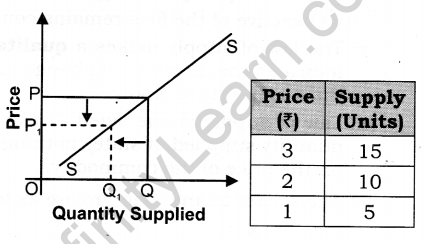
(iii) In the given diagram, quantity supplied is measured on horizontal axis whereas price is measured on vertical axis. A producer is supplying OQ quantity at OP price.
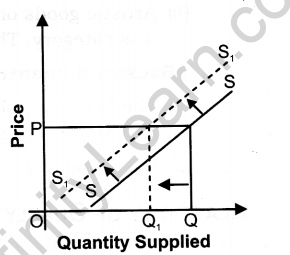
But, due to changes in the factors other than price the supply curve shifts leftward from SS to S1S1
With the leftward shift in the supply curve from SS to
S1S1 the quantity supplied falls from OQ to OQ1, which is known as decrease in supply.
Causes And Exceptions To The Law Of Supply
1. There is a positive relationship between price of the commodity and quantity supplied for that commodity which causes supply curve to slope upward from left to right.
2. It is because of the following reasons:
(a) Change in stock:
(i) With the increase in the price of the commodity sellers are ready to sell more from their old stock of goods.
(ii) On the other hand, when price of a commodity decreases, sellers would like to increase their stock to avoid losses.
(b) Profit and loss: With the rise in price producers generally increase their production in view of higher profit possibilities and vice-versa.
(c) Entry or exit of firms:
(i) When the price of a commodity increases, new firms enter into the industry with the view to earn profits which in turn increases the supply.
(ii) On the other hand, when price starts falling, marginal firms (or inefficient firms) leave the market to avoid expected losses which thereby decreases the supply.
3. Exceptions to law of supply are:
(a) Future expectations:
(i) The law will not apply if there are future expectations for further change in prices.
(ii) For example, if sellers expect further fall in prices in future, they would be ready to sell more even at low prices.
(b) Agricultural goods: The supply of agricultural goods depends more on natural factors such as drought, floods, natural calamities etc. and less on their prices.
(c) Perishable goods: The supply of perishable goods, like milk, vegetables, fish, eggs, etc. is also not affected by their prices. Sellers cannot hold these goods for long.
(d) Rare articles:
(i) In case of some precious and rare goods also, the law of supply does not apply.
(ii) Artistic goods of high quality and poems written by top class poets come under this categoiy. Their supply cannot be increased even when their prices rise.
(e) Backward countries:
(i) The law of supply loses its applicability in backward countries where production and supply cannot be increased merely because of rise in prices.
(ii) Here resources which are urgently required for production are lacking.
Elasticity Of Supply And Price Elasticity Of Supply(PES/ES)
1. The degree of responsiveness of quantity supplied due to the changes in determinants of supply (price of other commodity, price of factors of production, technology, etc.) is known as elasticity of supply.
2. (a) The degree of responsiveness of quantity supplied due to the changes in price of the commodity is known as price elasticity of supply.
(b) It is quantitative statement, i.e., it tells us the magnitude of the change in quantity supplied as a result of change in price.
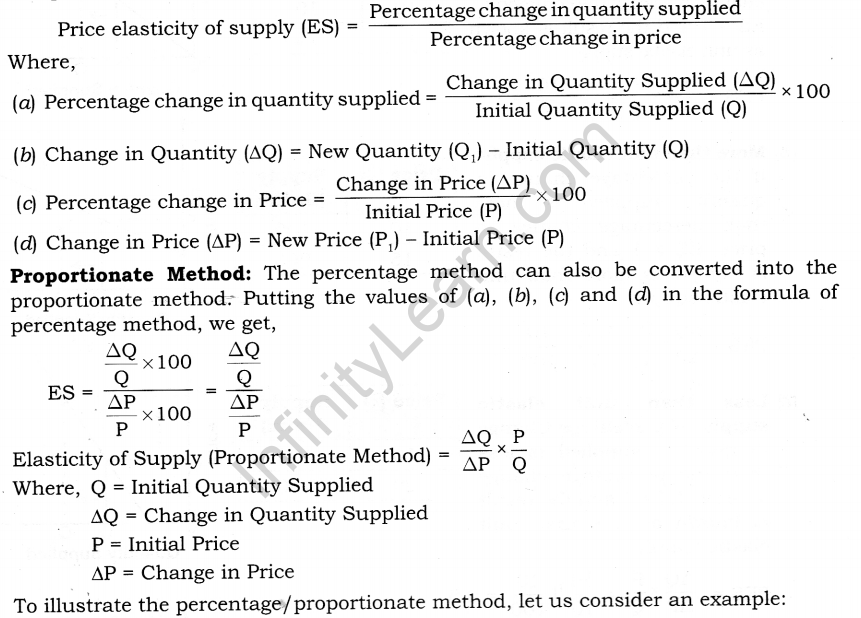
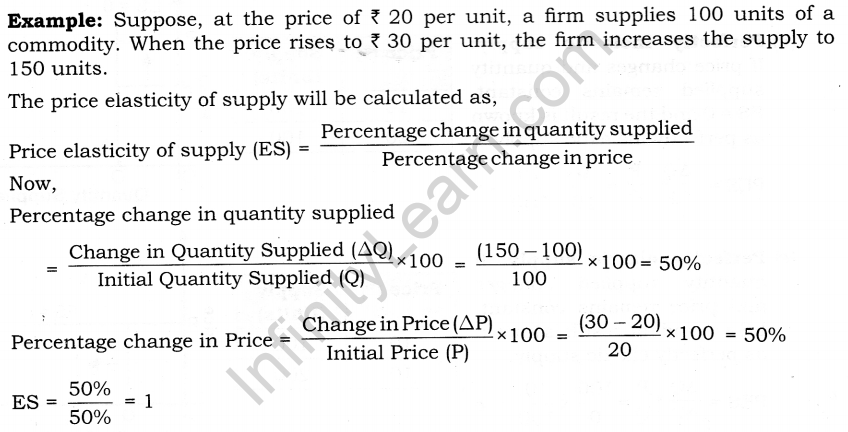
3. Percentage method/flux method for calculating price elasticity of supply:
According to this method, elasticity is measured as the ratio of percentage change in the quantity supplied to percentage change in the price.
(a) Percentage change in quantity supplied = Injtw Quantity Supplie(J |Q)
(b) Change in Quantity (AQ) = New Quantity (QJ – Initial Quantity (Q)
(c)Price elasticity of supply (ES) = Now,
(d) Change in Price (AP) = New Price (P,) – Initial Price (P)
Proportionate Method: The percentage method can also be converted into the proportionate method: Putting the values of (a), (b), (c) and (d) in the formula of percentage method, we get,
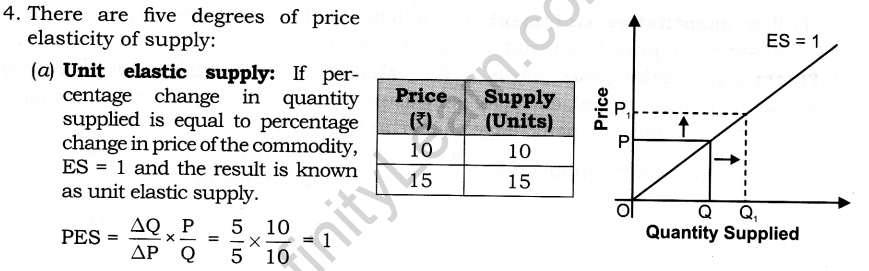
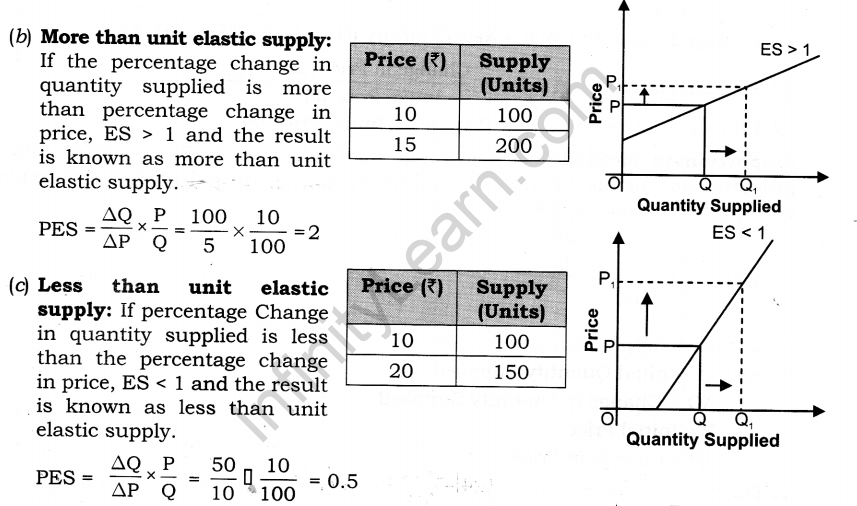
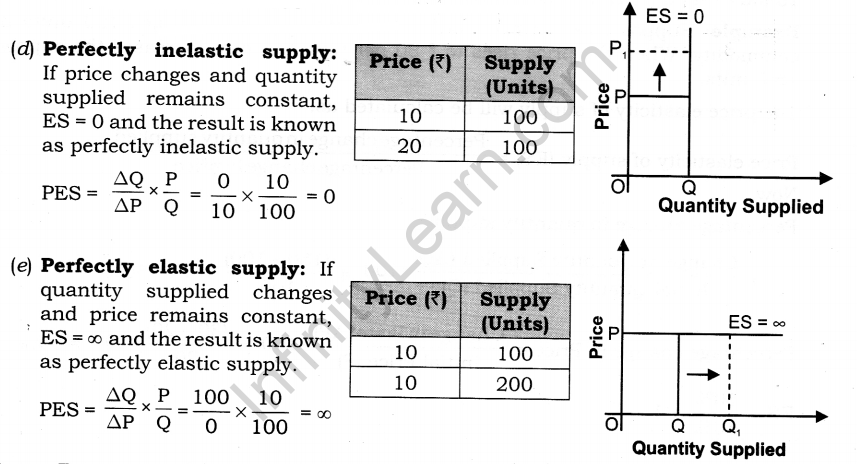
6.Factors Affecting Price Elasticity of Supply:
(a) Nature of the commodity: Elasticity of supply to some extent depends upon the nature of the commodity.
(i) For example, perishable goods have inelastic supply (because their supply cannot be increased or decreased) while the supply of durable goods is elastic.
(ii) Likewise, the supply of agricultural goods is inelastic while it is elastic in case of industrial goods.
(b) Cost of production
(i) If cost of production rises rapidly with the increase in output, there is less incentive to raise the supply with the increase in price. In such cases, supply will be inelastic.
(ii) However, if cost of production increases slowly with the rise in output, supply will increase with the rise in prices. In this case, supply will be more elastic.
(c) Time period
(i) In the market period, supply of a commodity is perfectly inelastic as supply cannot be changed immediately with the change in price.
(ii) In the short period, supply is relatively less elastic as firm can change the supply by changing the variable factors.
(iii) In the long period, supply is more elastic as all the factors can be changed and supply can be easily adjusted as per changes in price.
(d) Technique of production
(i) If simple techniques of production are employed in the production of a commodity, its supply will be elastic.
(ii) On the other hand, it becomes very difficult to change supply (in response to change in price) under complex techniques of production.
(e) Availability of resources and facilities
(i) The production of a commodity requires adequate resources and other facilities like irrigation, power, transportation, banking, etc. The producers feel handicapped in their absence or shortage. Hence, supply becomes inelastic.
(ii) On the other hand, if these resources and facilities are easily and adequately available, producers can easily respond to any change in price.
7. Time Horizons And Supply Curve
Time period which is available to a firm to adjust its supply also plays an important role in the shapes of supply curves.
(a) Short period:
(i) In the short period, supply is relatively less elastic as firm can change the supply by changing the variable factors only, as fixed factors cannot be change during short period.
The supply curve during short period is inelastic, i.e., percentage change in quantity supplied is less than percentage change in price as shown in the adjacent figure.
(b) Long period:
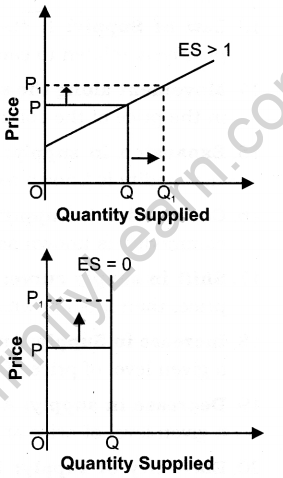
(i) In the long period, supply is more elastic as all the factors can be changed and supply can be easily adjusted as per changes in price.
(ii) The supply curve during long period is elastic, i.e., percentage change in quantity supplied is greater than percentage change in price as shown in the adjacent figure.
(c) Very short period (Market Period):
(i) In very short period (Market Period), it becomes very difficult for a firm to increase its production level even if price of its commodity has increased because factor inputs like new machinery, technical labour, etc. do not become available immediately.
(ii) Under such a situation, individual and market supply curve will take the shape of vertical line parallel to Y-axis as shown in the adjacent figure.
Words that Matter
1. Stock: It refers to total quantity of a particular commodity that is available with the firm at a particular point of time.
2. Supply: It refers to the quantity of a commodity that a firm is willing and able to offer for sale, at each possible price during a given period of time.
3. Market supply: It refers to the quantity of a commodity that all firms are willing and able to offer for sale at each possible price during a given period of time.
4. Supply function: It shows the relationship between quantity supplied for a particular commodity and the factor influencing it.
5. Individual supply function: It refers to the functional relationship between supply and factors affecting the supply of a commodity.
It is expressed as, = f(Px, P0, S, T, O)
6. Market supply function: It refers to the functional relationship between market supply and factors affecting the market supply of a commodity.
It is expressed as, Sx = f (Px, P0, Pf, St, T, O, N, F, M)
7. Supply schedule: It is a table showing various quantities of a commodity offered for sale corresponding to different possible prices of that commodity.
8. Individual supply schedule: It refers to the supply schedule of an individual firm in the market.
9. Market supply schedule: It refers to supply schedule of all the firms in the market producing a particular commodity.
10. Supply curve: It refers to a graphical representation of supply schedule. It shows direct relationship between price and quantity supplied, keeping other factor constant.
11. Individual supply curve: It refers to a graphical representation of individual supply schedule.
12. Market supply curve: It refers to a graphical representation of market supply schedule. It is obtained by horizontal summation of individual supply curves.
13. Law of Supply: It states that price of the commodity and quantity supplied are positively related to each other when other factors remain constant (ceteris paribus).
14. Movement along the supply curve: The change in quantity supply due to the change in the price of the commodity is known as Movement along the supply curve.
15. Expansion in supply: The rise in quantity supplied due to the rise in price of the commodity is known as expansion in supply.
16. Contraction in supply: The fall in the quantity supplied due to the fall in price of the commodity is known as contraction in supply.
17. Shift in supply curve: If supply changes due to the change in the factors other than price, then it is known as shift in supply curve.
18. Increase in Supply: An increase in supply means that producers now supply more at a given level of price of a commodity.
19. Decrease in supply: A decrease in supply means that producers now supply less at a given level of price of a commodity.
20. Elasticity of supply: The degree of responsiveness of quantity supplied due to the changes in determinants of supply (price of other commodity, price of factors of production, technology, etc) is known as elasticity of supply.
21. Price elasticity of supply: The degree of responsiveness of quantity supplied due to the changes in price of the commodity is known as price elasticity of supply.


