Income Determination Important Questions for class 12 economics Short-run Equilibrium Output
1. Short-run According to JM Keynes, ‘A period of time during which level of output is determined exclusively by the level of employment in the economy, is termed as short-run.’
2. Equilibrium Output It refers to the level of output where the Aggregate Demand is equal to the Aggregate Supply (AD = AS) in an economy. It signifies that whatever the producers intend to produce during the year is exactly equal to what the buyers intend to buy during the year.
Where, AD = C + I (for a two-sector economy)
and AS = C + S
Where, AD = Aggregate Demand, AS = Aggregate Supply
C = Consumption, I = Investment, S = Saving
3. Determination of Equilibrium Output
We have two approaches to study the determination of equilibrium output/income.
(i) AD = AS Approach
According to the modern theory, income and employment are determined at the level, where Aggregate Demand is equal to Aggregate Supply.
It is illustrated with the help of a diagram
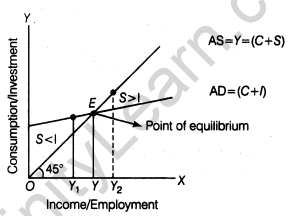
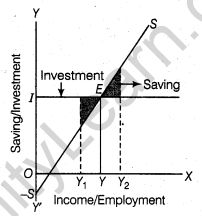
This is illustrated with the help of the above diagram.
4. Ex-ante Saving The planned or desired saving during an accounting year is termed as ex-ante saving. These are desired savings by the people for one year.
5. Ex-ante Investment The planned or desired investment expenditure which is intended to be made in an economy during an accounting year, is termed as ex-ante Investment.
6. Ex-post Saving The actual saving in the economy during a period of one year is termed as ex-post saving.
7.Ex-post Investment The actual investment expenditure during a period of one year is termed as ex-post investment.
8. Shifts in Equilibrium In an economy, the flow of income changes due to injections and withdrawals in the circular flow of income. Injections boosts the flow of income and cause positive multiplier effect. On the other hand, withdrawals reduces the flow of income and cause a negative multiplier effect. Investment is considered as an injection and savings is treated as a withdrawal from the circular flow.
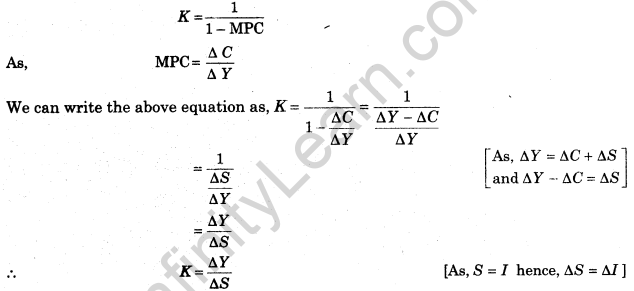
9. Investment Multiplier The ratio between change in income and the change in investment is termed as investment multiplier. It is denoted by K.
 It represents the responsiveness of income to change in the investment.
10. Relationship between Multiplier (K) and Marginal Propensity to Consume (MPC) There is a direct relationship between multiplier and MPC. Higher the value of MPC, higher the multiplier and vice-versa.
Infact, multiplier can also be estimated using the following formula, K=1/1-MPC
11. Relationship between Multiplier (K) and Marginal Propensity to Save (MPS) There is an inverse relationship between multiplier and MPS. Higher the values of MPS, lower the multiplier and vice-versa.
In fact, multiplier can be estimated using the following formula, K=1/MPS
12. Derivation of Investment Multiplier
1 Mark Questions
1. Give the meaning of ex-ante savings. (Delhi 2010)
Ans. The planned or desired savings during an accounting year is termed as ex-ante saving. These are desired savings by the people for one year.
2. What is ex-ante Aggregate Demand? (All India 2010)
Ans. The planned expenditure on the purchase of goods and services in an economy during a period of one year, is termed as ex-ante Aggregate Demand.
3. When will there be equilibrium level of National Income? (All India 2010)
Ans. When Aggregate Demand is equal to Aggregate Supply (AD = AS) in an economy at full employment level, then it is termed as the equilibrium level of National Income.
4. What can be the minimum value of investment multiplier? (Delhi 2009)
Ans. The minimum value of investment multiplier is 1.
5. If the investment multiplier is 1, what will be the value of Marginal Propensity to Consume? (Delhi 2009)
Ans. If the investment multiplier is 1, the value of Marginal Propensity to Consume is 0.
Multiplier (K) =1/1-MPC
1=1/1-MPC
1- MPC =1
1 -1 = MPC = 0
3 Marks Questions
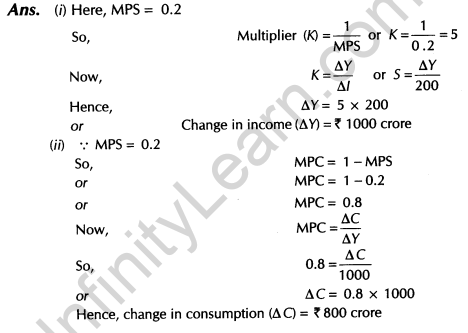
1. Explain the meaning of investment multiplier. What can be its minimum and maximum value? (Compartment 2014)
Ans. Investment multiplier is the ratio between change in income and the corresponding change in investment. It represents the responsiveness of income to change in investment. It is denoted by K. Symbolically,
![]() MPC is Marginal Propensity to Consume.
MPC is Marginal Propensity to Consume.
The value of Multiplier depends on the value of MPC.
 7. Explain the relationship between investment multiplier and Marginal Propensity to Consume. (Delhi 2011)
Ans. There is direct or positive relationship between MPC and multiplier. Higher the MPC, higher will be the value of multiplier and vice-versa
Multiplier (K) =1/1-MPC
e.g. If MPC =0.5, then K will be, K =1/1-0.5=2
When MPC increase to 0.75, then K will be
K=1/1-0.75=1/0.25=4
8.As a result of increase in investment by Rs. 60 crore, National Income rises to Rs. 240 crore. Calculate Marginal Propensity to Consume.
(All India 2011)
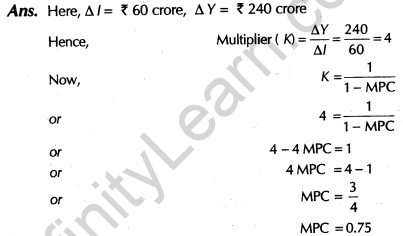
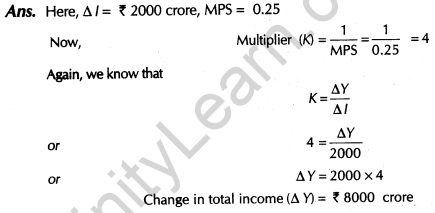
9. In an economy, investment is increased by Rs. 2000 crore. Calculate the change in total income, if Marginal Propensity to Save is 0.25.
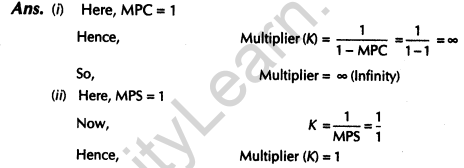
10. Find the value of multiplier given (i) Marginal Propensity to Consume = 1 and (ii) Marginal Propensity to Save = 1. (All India 2010)
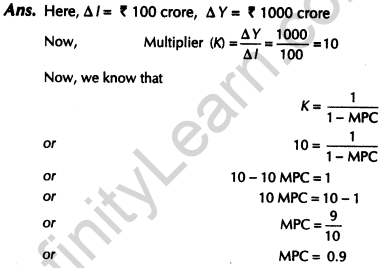
11. In an economy, asa result of increase in investment by Rs. 100 crore, National Income rises by Rs. 1000 crore. Find Marginal Propensity to Consume. (Delhi 2010c)
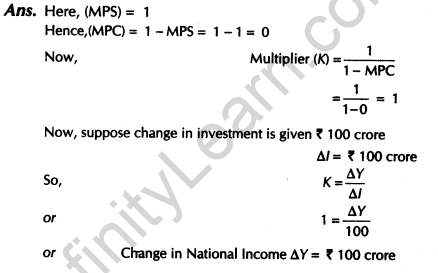
12. If Marginal Propensity to Save is one, what is the value of multiplier? What can you say about the change in National Income, given change in investment. (Delhi 2010C)
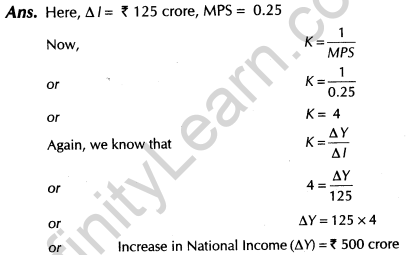
13. Given Marginal Propensity to Save equal to 0.25, what will be the increase in National Income, if investment increases by Rs.125 crore? Calculate. (All India 2008)
4 Marks Questions
14. State whether the following statements are true or false. Give reasons for your answer
(i)When Marginal Propensity to Consume is greater than Marginal Propensity to Save, the value of investment multiplier will be greater than 5.
(ii) The value of Marginal Propensity to Save can never be negative.
(Delhi 2010)
Ans. (i) No, the statement is false. This can be understood by an example. Suppose, the value of MPC = 0.6,
hence, MPS = 0.4 (as MPS = 1 – MPC)
Here, MPC > MPS
Now, K=1/1-MPC=1/1-0.6
=1/0.4=2.5
So, K < 5 even if MPC > MPS.
(ii) Yes, the statement is true.
As MPS tells about the change in savings due to change in income and change is saving will always be positive even if savings is negative, as with rise in income, savings rise at a faster rate than consumption, so MPS can never be negative.
15. Giving reasons, state whether the following statements are true or false.
(i) Average Propensity to Save is always greater than 0.
(ii) Value of investment multiplier varies between zero and infinity. (Delhi 2010)
Ans. (i) No, the statement is false.
When Average Propensity to Consume (APC) is greater than one (i.e. when consumption is greater than income), Average Propensity to Save (APS) will less than or equal to zero.
(ii) No, the statement is false.
We know that, K =1/1-MPC so even if the MPC will have its minimum value, i.e. 0, the investment multiplier will be 1.
Similarly, when MPC = 1, the value of investment multiplier is infinity.
Hence, value of investment multiplier varies between one and infinity.
16. Giving reasons, state whether the following statements are true or false
(i) When Marginal Propensity to Consume is zero, the value of investment multiplier will also be zero.
(ii) Value of Average Propensity to Save can never be less than zero.
(All India 2010)
Ans. (i) No, the statement is false.
When Marginal Propensity to Consume is zero, the value of investment multiplier will be 1 (not zero).
K=1/1-MPC or K=1/1-0=1/1=1
17. Giving reasons state whether the following statements are true or false
(i) If the ratio of Marginal Propensity to Consume and Marginal Propensity to Save is 4 : 1, the value of investment multiplier will be 4.
(ii) Sum of Average Propensity to Consume and Marginal Propensity to Consume is always equal to 1. (All India 2010)
Ans. (i) No, the statement is false.
If the ratio of MPC and MPS is 4 : 1, then the value of investment multiplier is 5.
MPC=4/4+1=4/5=0.8 as (MPC/MPS=4/1)
K=1/1-0.8=1/0.2=5
(ii) No, the statement is false.
APC and MPC can have values other than 1.

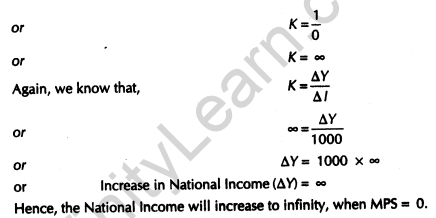
18. Investment in an economy rises by Rs. 1000 crore. Suppose Marginal Propensity to Save is 0. What can you say about the increase in National Income? Calculate. (All India 2009)

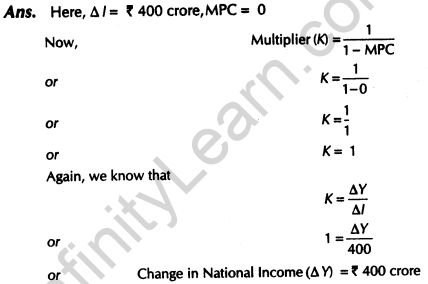
19. Investment in an economy rises by Rs. 400 crore. Marginal Propensity to Consume is zero. Calculate the change in National Income.
(All India 2009)
20. There is an increase in investment of Rs. 100 crore in an economy. Marginal Propensity to Consume is 1. What can you say about total increase in the income? Calculate. (Delhi 2009 c)
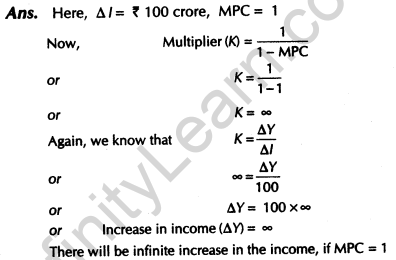
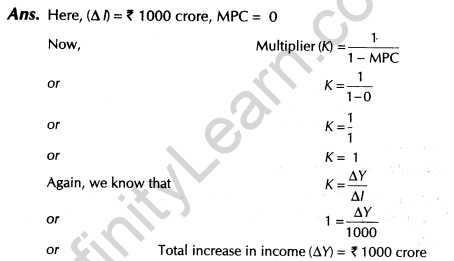
21. There is an increase in investment of Rs. 1000 crore in an economy. Marginal Propensity to Consume is 0. What is the total increase in income? Calculate. (Delhi 2009C)
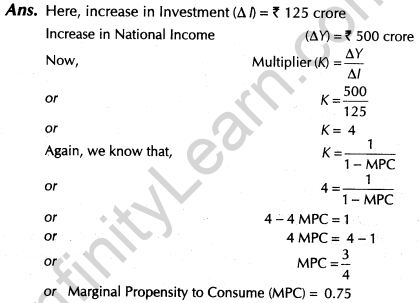
22. As a result of increase in investment of Rs. 125 crore, National Income increases by Rs. 500 Calculate Marginal Propensity to Consume. (Delhi 2008)
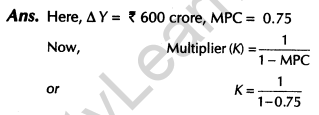
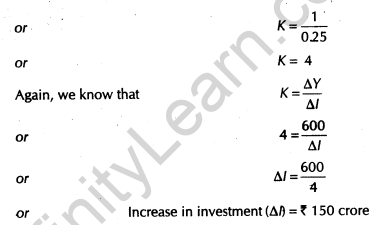
23. As a result of an increase in investment National Income rises by Rs. 600 crore. If Marginal Propensity to Consume is 0.75, calculate the increase in investment. (Delhi 2008)
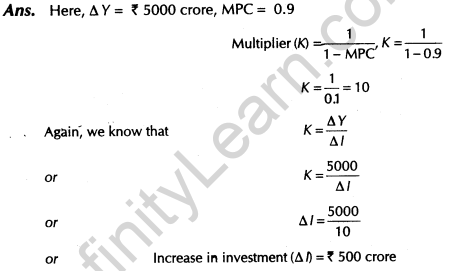
24. If Marginal Propensity to Consume is 0.9, what is the value of multiplier? How much investment is needed to increase National Income by Rs. 5000 crore? Calculate. (Delhi 2008)
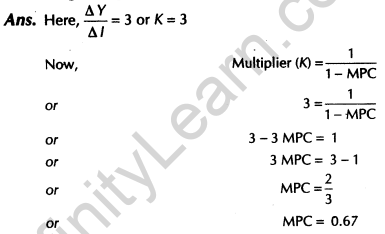
25. In an economy an increase in investment leads to an increase in National Income which is three times more than the increase in investment. Calculate Marginal Propensity to Consume. (All India 2008)
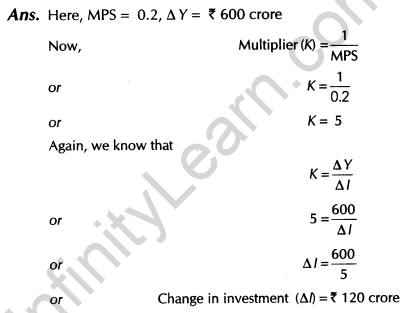
26. If Marginal Propensity to Save is 0.2, how much new investment is required to ational Income rise by RS. 600 crore? Calculate.
(All India 2008)
6 Marks Questions
27. When is an economy in equilibrium? Explain with the help of saving and investment function. Also, explain the changes that take place in an economy when the economy is not in equilibrium. Use diag (All India 2014)
Ans. Equilibrium level of income is determined at a point, where ex-ante or planned saving is equal to planned investment. This is because, in equilibrium. AS = AD or C+S=C + l or S=l
Saving is that part of income which is not spent on consumption expenditure
We know that, Y = C + S
or Y is the Aggregate Supply of the economy.
Investment refers to expenditure on capital goods and capital stock during one year,
We know that, AD = C + /
Now, at equilibrium situation, AD = AS
or C + S = C + l or S = l
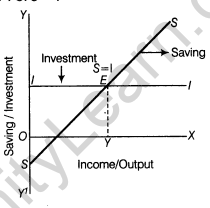
E is the point where 5 = l , hence the point at which the economy is in equilibrium. OY is the equilibrium level of National Incomes
When savings is greater than investment in an economy, it refers to AD < AS. There will be a rise in inventory stock and prices will start to fall. To clear their stocks, the producers would now plan lesser output. This would mean lesser income in the economy. Lesser income implies lesser saving. The process would continue till S = l.
But if investments are more than savings, it means that AS < AD. Stocks would reduce and prices will start to rise. To stand benefitted from such a condition, the producers will increase their production, leading to an increase in AS. The process would continue till S = l.
28. Explain National Income equilibrium through Aggreate Demand and Aggregate Supply. Use diagram. Also explain the changes that take place in an economy when the economy is not in equilibrium. (Delhi 2014)
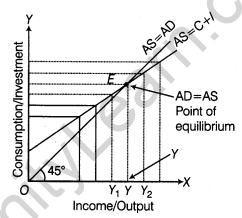
Ans. In an economy, equilibrium livel of income and employment is determined when AD (Aggregate Demand) is equal to AS (Aggregate Supply).
According to Keynes, AS may be assumed to be perfectly elastic in an economy where full employment (of resources) is yet to be achieved. Accordingly, AD becomes the principal determinant of equilibrium level of income.
In the following figure, AD represents aggregate demand curve and 45° line is the line of reference, where AS – AD. Equilibrium level of income Y is determined at point E, where AD = AS, Prior to point E, Aggregate Demand exceeds Aggregate Supply leading to an increase in level of income upto point E, Aggregate Supply exceeds Aggregate Demand leading to a fall in income back towards point E.
It is only when AS = AD that the equilibrium is struck. Because the equality between AS and AD implies that the desired level of output in the economy (as indicated by AS) is exactly equal to the desired level of expenditure (indicated by AD) in the economy. So that, the entire output as planned by the producers (during and accounting year) is purchased by the buyers. There are on undesired or unwanted inventories (stock of goods) with the producers.
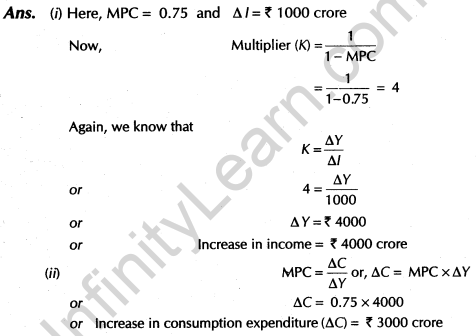
29. In an economy 75% of the increase in income is spent on consumption. Investment is increased by 11000 Calculate. (Delhi 2010)
(i) Total increase in income.
(ii) Total increase in consumption expenditure.
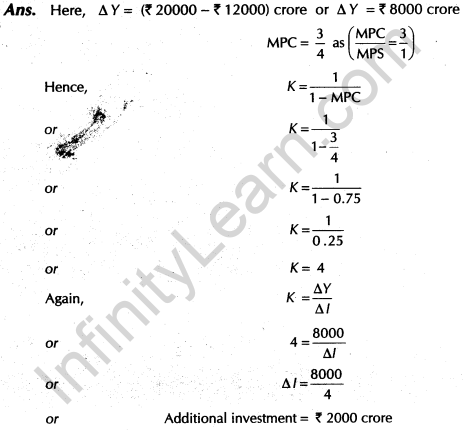
30. In an economy, the equilibrium level of income is Rs. 12000 The ratio of Marginal Propensity to Consume and Marginal Propensity to Save is 3:1. Calculate the additional investment needed to reach new equilibrium level of income of Rs. 20000 crore. (All India 2010)
31. How is saving and investment approach derived from the Aggregate Demand and supply approach of income determination? Explain and use diagram. (Delhi 2010c)
Ans. The equilibrium level of income or output is that level at which the planned savings and planned investments are equal. It is derived from Aggregate Demand and supply approach in the following way: Aggregate Demand in a two sector economy is defined as the sum of consumption expenditure(c) and investment expenditure (I) i.e. AD = C + I, where as Aggregate Supply is defined as the sum of consumption (c) and savings (s) i.e. AS = C + S.
Mathematically, AD = AS
C + l = C+S
Hence, l = S
or S = l
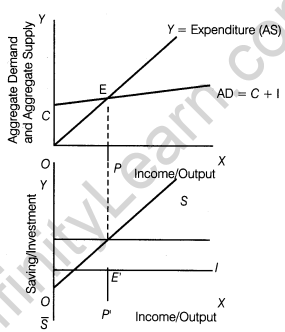
OP or OP’ is the equilibrium level of income. E is the equilibrium point where Aggregate Demand equals Aggregate Supply. Equality between AS and AD implies the equality between S and l. When we stretch the line EP vertically downward, it meets at point E’ with S and l. It is the equilibrium point of saving and investment approach OP or OP’ represents the level of income at which the economy is in equilibrium.
32. Given consumption function C = 100 + 0.75 Y (where, C = Consumption expenditure and Y = National Income) and investment expenditure Rs. 1000, calculate
(i) Equilibrium level of National Income
(ii) Consumption expenditure at equilibrium level of National Income (Delhi 2009)
Ans. (i) Equilibrium level of National Income
know that, Y = C + /
or Y= 100 + 0.75 Y+1000 (as, l=Rs. 1000)
or y-0.75 y= 1100
or 0.25Y=1100
or Y=1100/0.25
or National Income (Y) = Rs. 4400
(ii) Consumption expenditure at equilibrium level of National Income
Now, Y=C+l
or 4400= C+1000
or C=4400-1000
or Consumption expenditure (C)= Rs. 3400
33. What changes will take place to bring an economy in equilibrium, if
(i) Planned savings are greater than planned investment
(ii) Planned savings are less than planned investment (Delhi 2009)
Ans. The situation when S > l or when S < l are explained with the help of following figure:
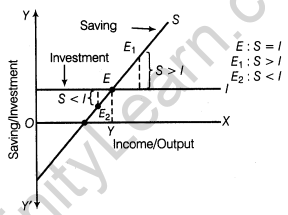
In the diagram, equilibrium is struck at point E when 5 = /. Equilibrium level of income = OY.
Ans. The situation when S > l or when S < l are explained with the help of following figure:
Let us consider a situation when 5 > l. It happens at point E1,.
In such a situation, the following changes will occur
(i) Stocks of the producers would be in excess of the desired limit.
(ii) Profits will start shrinking.
(iii) Desired level of output for the subsequent year will face a cut.
(iv) Levels of income and employment will tend to shrink to the point where S =l, corresponding to point E in the diagram.
Thus, the economy will come back to the state of equilibrium.
Now, consider a situation when S < l. It happens at point E2. It is a situation when AD>AS.
In such a situation, the following changes will occur
(i) Existing stocks of the producers are not enough to cope with the level of AD.
(ii) Profits will not be maximum, because the desired level of stock is not available.
(iii) Producers will plan higher level of output for the subsequent years.
(iv) Level of output and employment will rise to drive the economy to the point of equilibrium at point E.
34. In an economy, S = – 50 + 0.5 Y is the saving function (where, S = Saving and Y = National Income) and investment expenditure is Rs. 7000. Calculate (All India 2009)
(i) Equilibrium level of National Income
(ii) Consumption expenditure at equilibrium level of National Income
Ans.(i) At equilibrium situation,
S= l
or -50 + 0.5 Y= 7000
or 0.5 Y= 7000 + 50
or Y=7050/0.5
or National Income (Y)=Rs. 1400
(ii) Again, we know that Y = C + l
or 14100= C+7000
or C = 14100-7000
or Consumption expenditure (C) = Rs. 7100
35. In an economy, C = 200 + 0.9 Y is the consumption function (where, C = Consumption expenditure and Y = National Income) and investment expenditure is Rs. 3000. Calculate (All India 2009)
(i) Equilibrium level of National Income
(ii) Consumption expenditure at equilibrium level of National Income
Ans. (i) We know that, Y = C + /
or Y = 200 + 0.9 Y+3000 (as l=Rs. 3000)
or 0.1 Y= 3200
or National Income (Y)=Rs. 32000
Ans. The determination of income and employment in the Keynesian model depends on the level of AD and AS. The point where AD = AS, i.e. Aggregate Demand meets, the Aggregate Supply is known as equilibrium point.
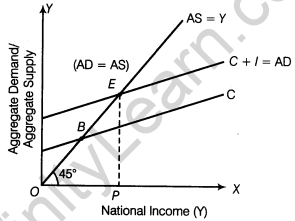 When AD is greater than AS, flow of goods and services in the economy tends to be less than their demand. The exisiting stocks of the producers would be sold out. To rebuild the desired stocks, the producers would plan greater production. AS would increase to become equal to AD.
Aggregate Demand (AD) is the sum of demand for consumption and investment. In the above figure, C is the consumption curve which meets AS curve at B. B becomes the break even point where savings is O. Again, E is the point where AD curve meets the AS curve and it is the equilibrium point. OP is the level of national income where AS = AD and is known as equilibrium income.37. Explain the determination of National Income using ‘saving and investment approach, with the help of a diagram. Explain the changes that take place when saving is greater than investment. (Delhi 2009c)
Ans. Saving is that part of income which is not spent on consumption expenditure.
We know that, Y = C + S
or Y is the Aggregate Supply of the economy.
Investment refers to expenditure on capital goods and capital stock during one year,
We know that, AD = C + l
Now, at equilibrium situation, AD = AS
or C + S = C + l or S = l
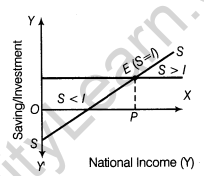
E is the point where S = l, hence, the point at which the economy is in equilibrium. The point P refers to the equilibrium level of National Income.
When savings is greater than investment in an economy, it refers to AD < AS. There will be a rise in inventory stock and prices will start to fall. To clear their stocks, the producers would now plan lesser output. This would mean lesser income in the economy.
Lesser income implies lesser saving. The process would continue till S = l
(i) Equilibrium level of income.
(ii) Consumption expenditure at equilibrium level of income. (Delhi 2008)
Ans. Here, C = 500 + 0.9 Y
l =Rs. 1000
Y= Rs. C+l
or Y=500+0.9 Y+ 1000
or Y-0.9 Y= 1500
or Income (Y) = 15000
39. Explain determination of equilibrium level of income using consumption plus investment (C +l) approach. Use diagram. (Delhi 2008)
Ans. Equilibrium level of income is the point, where Aggregate Demand equals to Aggregate Supply in an economy.
Let us derive the equilibrium with the help of a schedule

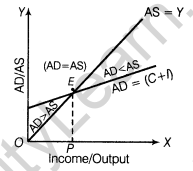
E represents the equilibrium point and OP represents the equilibrium level of National Income, where AD = AS. To the left of point E, AD > AS, where as to the right of point E, AD < AS.
40. In an economy, C = 300 + 0.8 Y and I = 500 (where, C = Consumption, Y = Income and I = Investment). Calculate the following
(i) Equilibrium level of income
(ii) Consumption expenditure at equilibrium level of income (All India 2008)
Ans. (i) Here, l = Rs. 500
C = 300 + 0.8 Y
Now, we know that, Y = C+l
or Y= 300 + 0.8 Y+500
or Y-0.8 Y= 800
or 0.2 Y= 800
or Y=800/0.2
or Income (Y) =Rs. 4000
(ii) We know that,
Y= C+l
or 4000 = C + 500
or C = 4000 – 500
or Consumption expenditure (C) = Rs. 3500
41. In an economy, with every increase in income, 10% of the rise in income is saved. Suppose a fresh investment of Rs. 120 crore take place in the economy. Calculate the following
(i) Change in income (ii) Change in consumption (All India 2008)
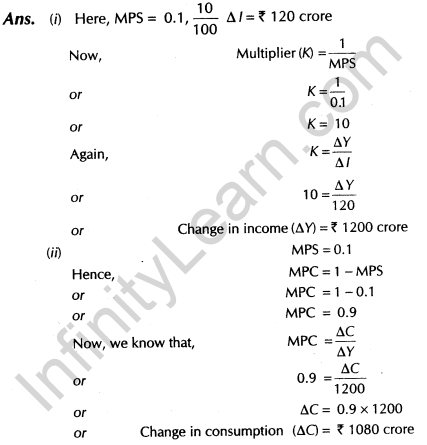
42. In an economy, C = 500 + 0.75 Y and I = 800 (where, C = Consumption, Y = Income, I = Investment). Calculate the following
(i) Equilibrium level of income
(ii) Consumption expenditure at equilibrium level of income
(All India 2008)
Ans. (i) Here, l = Rs. 800, C = 500 + 0.75 Y
Now, we know that, Y= C+ /
or Y= 500 + 0.75 Y + 800
Y- 0.75 Y = 1300
or 0.25 Y = 1300
or Y=1300/0.25
or Income (Y) = 5200
(ii) Again, Y = C+ /
or 5200 = C + 800
or C= 5200-800
or Consumption expenditure(C)=Rs. 4400
43. In an economy, with every increase in income, 70% of the increased income is spent on consumption. Suppose a fresh investment of Rs. 300 crore takes place in the economy. Calculate
(i) Change in income (ii) Change in saving (Delhi 2008)
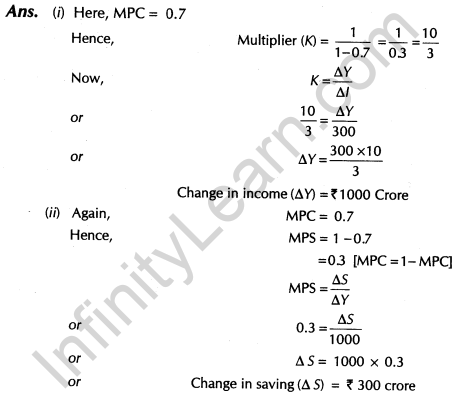
44. In an economy, every time income rises, 75% of the rise in income is spent on consumption. Now, suppose in the same economy, investment rises by Rs. 750 crore. Calculate the following
(i) Change in income (ii) MPS (Delhi 2008C)
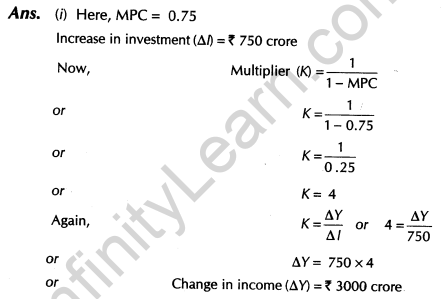 (ii) Now, MPS = 1 – MPC
or MPS = 1-0.75 or MPS = 0.25
45. In an economy C = 300 + 0.5 Y and I = Rs. 600
(where, C = Consumption, Y = Income, / = Investment). Calculate the following
(i) Equilibrium level of income
(ii) Consumption expenditure at equilibrium level of income
(Delhi 2008C)
Ans. (i) Here, l = Rs. 600 and C = 300 + 0.5 Y
Now, we know that, Y=C+l
or Income (Y) = Rs. 1800
(ii) Again, Y = C+l
or 1800= C+600
or C = 1800-600
or Consumption expenditure (C) = Rs. 1200
46. In an economy, everytime income rises, 20% of rise in income is saved. Now, suppose in the same economy investment rises by ? 200 crore. Calculate the following
